Helping Inspired Minds Art Center Sharpen Its Focus
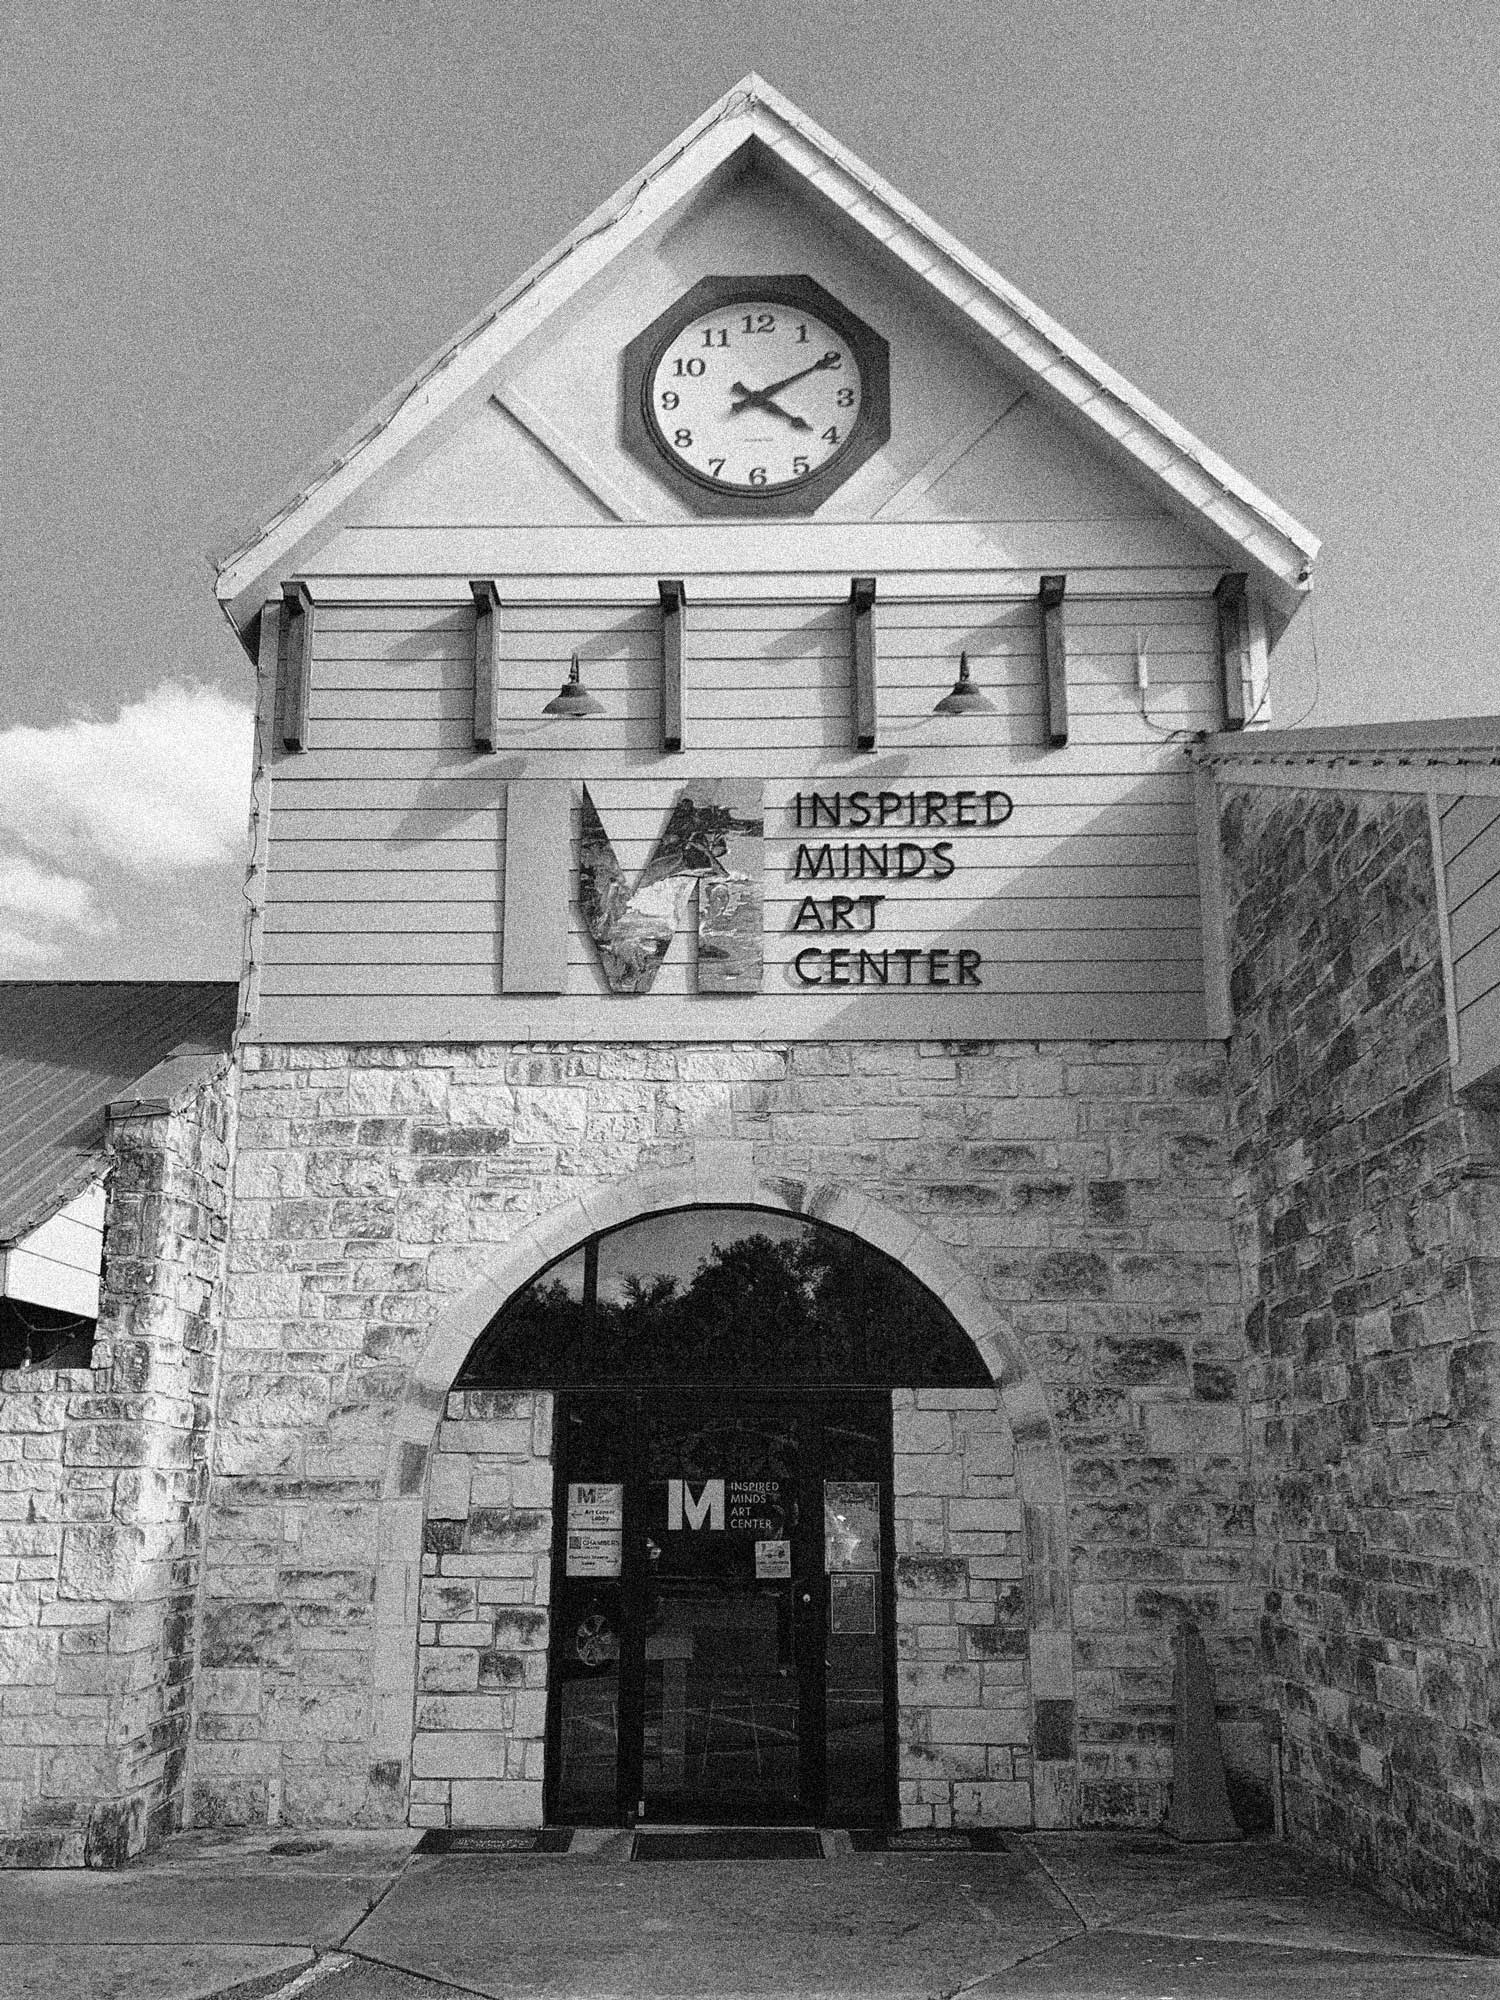
Inspired Minds Art Center operates thirteen different business lines. Two of these, multi-week courses and camps, account for 65% of the center’s net income. The remaining eleven emerged organically as the founders responded to community interest, instructor availability, and the creative possibilities of their 5,500-square-foot facility. By 2025, the range of offerings had grown faster than the tools available to evaluate them. That was the strategic situation the founders asked us to help with: identifying which of the thirteen lines deserved more investment, and which had served their purpose.
In August 2025, our consulting team partnered with Inspired Minds, a woman-owned arts facility located in Buda, Texas, as part of the MBA program at Texas State University under the guidance of Dr. David Cameron. The engagement lasted twelve weeks and included team members Marty Spellerberg, Carole Callahan, and Hsin Sher. The founders, Sinéad Whiteside and Susan Guerra, had successfully navigated the pandemic and were experiencing increased registrations. However, they faced unstable cash flow, their 5,500-square-foot facility was underutilized, and rapid residential growth in their service area (7,000 new homes under construction) was not translating into enrollment gains. Our task was to help them see their operation clearly so that they could decide where to focus.
Work With the Data you Have
The 12-week timeline ruled out collecting new data, so we had to rely on existing records. The founders provided eight months of profit-and-loss statements broken down by business line, three years of enrollment data from their Sawyer registration system (totaling 4,333 course offerings), and over 150 customer satisfaction surveys and reviews.
The enrollment data was not clean. For example, naming conventions have varied over the years, with “Introduction to Wheel Throwing” appearing in seventeen different formats. Additionally, the system tracked courses year by year rather than grouping them by content. To address this, we collaborated with Susan in Tableau Prep Builder to create a standardized taxonomy, merging the different variants into comparable categories. We then calculated demand as the sum of booked spots and waitlisted spots divided by available spots, allowing us to compare a ten-seat pottery class to a thirty-seat camp on the same scale.

Regression for Patterns, Feedback for Reasons
We built a multiple regression model to estimate enrollment demand based on factors such as location, schedule type (camps vs. courses), day of the week, and time slot. The model proved statistically significant (F = 35.63, p < 0.0001), explaining 22% of the variance. The analysis revealed three key attributes that correlated strongly with demand: theater camps exceeded the baseline by 61 percentage points, pottery wheel sessions performed better by 24 points, and offerings on Saturdays increased demand by 11 points. Summer weeks 1–8 performed well while week 10 dropped sharply. To better understand these trends, we analyzed qualitative data from over 150 post-class surveys and reviews. This analysis revealed recurring themes in customer feedback, with numerous unprompted requests for "more theater" and "kids' theater." Pottery wheel sessions drew the highest praise, with reviewers often citing wheel throwing by name. Customers expressed a desire for twice-weekly sessions and more weekday afternoon slots from 4 to 6 p.m., consistently mentioning specific instructors. The two analyses pointed to the same conclusions. When the regression coefficients and customer feedback aligned, our recommendations carried the weight of both statistical evidence and expressed preferences. For instance, theater camps not only showed a positive coefficient in the data but also drew explicit requests from customers. Similarly, pottery wheel sessions performed well in terms of numbers and drew positive reviews. The regression's 22% explained variance left a considerable amount of data unexplained. And on the other hand, qualitative data without quantitative validation risked overemphasizing the opinions of the loudest voices. The findings we took forward were the ones that appeared in both.
What we Recommended
The findings led to a concise list of operational recommendations: prioritizing pottery programming, especially wheel-throwing; expanding theater offerings during peak demand periods; concentrating summer programming in weeks 1–8; converting underperforming workshops into multi-week courses; scheduling activities for Saturdays and weekday afternoons; and reducing morning and late-evening offerings.
In our final report, we organized our recommendations into three categories: programming, marketing, and facilities. We included phased implementation milestones and key performance indicators that the founders could track without adopting new software.
What This Work Taught Us
Here are some principles we would apply in a similar engagement: spend time on data consolidation before analysis; pair quantitative pattern analysis with qualitative feedback from available customer insights; treat convergence between the two as a confidence signal; and translate findings into actionable decisions the organization can realistically implement given its available resources.
What Sinéad and Susan have built in Buda is the kind of place a community grows around, and we’re grateful they trusted us to work through the data with them.
Posted August 2026