Google Maps
Canadian Tire Interactive Map
This prototype Store Locator was created in-house at Canadian Tire Corporation in late 2006 by developer Marty Spellerberg using JavaScript and the Google Maps API.
Check out the Canadian Tire Interactive Map!

Integrating WordPress and Google Maps API V.3
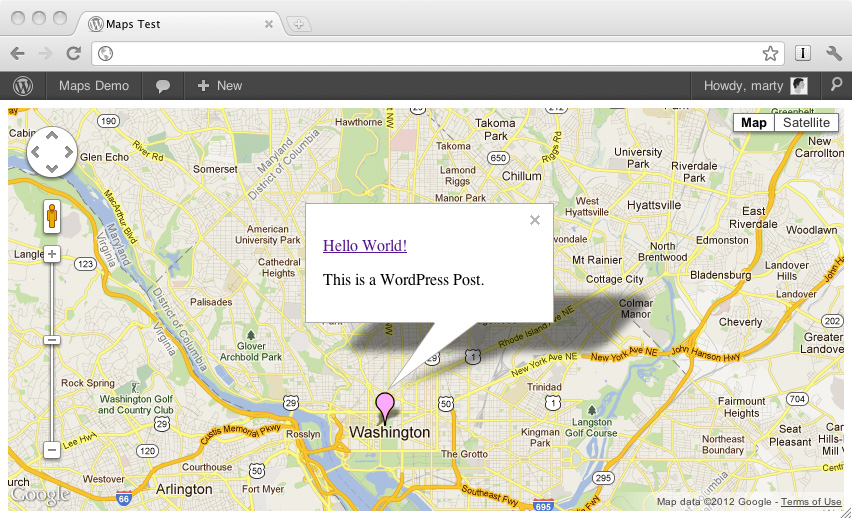
Here we will go through the steps for creating a Google Maps interface for a WordPress blog. Posts will appear as markers on the map, which you can click to reveal the post content in the Google Maps Infowindow.
Download a ZIP of the complete example.
Note, August 24 2013: In August 2013 Google updated the API to a new visual style that more closely matches their core products. One of the changes is that markers no longer display shadows. There may be other side effects as well, though as of this writing everything else seems to work properly. More investigation is warranted.
Also, a lot of people have trouble getting their markers to display. Often this has to do with the path to the image file. If you download the ZIP from Github, you will likely need to update the paths in map.js. Eventually I’ll revise the tutorial to address this, but in the meantime it’s something to keep an eye out for.
I’m starting with a fresh WordPress install, which at the time of this writing is v. 3.3.1. You may be modifying an existing theme, but for the sake of this tutorial, I’ll start a new one. But note that I’ll be doing only the minimum here to create a working demo, omitting much that is necessary for an actual, standards-compliant and useful website.
Add Location Data to Posts
Update: I’ve published the Address Geocoder plugin for WordPress that simplifies the process of adding location data to posts. I recommend using it instead of the custom fields technique outlined here. After installing it, skip to the next section, “Initialize Custom Theme,” below. Your code will need to be modified in three places, as noted below.

In order to know where to place a marker on a map, the Google Maps API needs to be supplied with latitude and longitude coordinates in the format of a LatLng object. We’re going to include this as a Custom Field with our posts.
Navigate to the Post Edit page and scroll down to the Custom Fields box. (If you don’t see it, you may need to turn it on via the Screen Options button at the top of the page.)
Name the custom field “latlng.” Now, there are various geocoding services on the web that allow you convert an address to latlng (including the Google Maps API itself, but that’s another topic). For this example we’ll use the White House. Go to Geocoder.us and enter “1600 Pennsylvania Avenue NW, Washington DC”. It will spit out a number in brackets such as (38.898748, -77.037684). Use that as the value and press Add Custom Field.
If you like, you can optionally create a few more posts and geocode them with locations in Washington DC.
Initialize a Custom Theme
In the wp-content/themes directory, create a new folder; mine will be called mapdemo. In this new folder, create a blank file called style.css and one called index.php; these are the minimum needed to created a WordPress theme. Also create a file called map.js.
To make our theme recognizable by WordPress we will place what’s called a theme header into our style.css. The very minimum header is as follows:
/*
Theme Name: Map Demo
*/ |
You can now go ahead and activate your theme using the WordPress dashboard (Appearance -> Themes). But if you load your blog at this point you will see that it’s totally blank. Let’s put in the bare-bones of an HTML page, with a couple of functions required by WordPress. Put the following into index.php:
<html> <head> <title>Maps Test</title> <?php wp_head(); ?> </head> <body> <?php wp_footer(); ?> </body> </html> |
Link the JavaScript Files
Our map will be created using two JavaScript files: The Google Maps API library and our own maps.js. We do this in the head section of index.php, after the title tag. To include the API we will link directly to the file on Google’s server:
<script type="text/javascript" src="http://maps.googleapis.com/maps/api/js?sensor=false"></script> |
And to include maps.js we will do something similar, but you’ll notice that we use WordPress’ get_stylesheet_directory_uri() function to dynamically write the path to the file in our theme directory:
<script type="text/javascript" src="<?php echo get_stylesheet_directory_uri() ?>/map.js"></script> |
Create the Map
WordPress uses something called The Loop to display posts. Let’s get that started by testing if, given the parameters passed via the URL, WordPress has any posts to display. In index.php, after the opening body tag, write:
<?php if ( have_posts() ) : ?> <!-- WordPress has found matching posts --> <?php else : ?> <!-- No matching posts, show an error --> <h1>Error 404 — Page not found.</h1> <?php endif; ?> |
Note: If you are interested in using this with a custom post type, depending on the context your loop may look different. Perry at Point At The Moon has posted a follow-up tutorial that includes custom post types.
Next create a DIV element that will be the container for our map; we’ll tell the API its name and Google will fill it with magic! We’ll use CSS to make it fill the window. After the line with the “WordPress has found matching posts” comment, write:
<div id="map" style="width: 100%; height: 100%;"></div> |
Now open up maps.js. We’re going to create a JavaScript function that loads in a map with a few settings, which I won’t go into the details of here, but are well documented. Write:
function initialize() { map = new google.maps.Map(document.getElementById('map'), { zoom: 12, center: new google.maps.LatLng(38.898748, -77.037684), mapTypeId: google.maps.MapTypeId.ROADMAP }); } |
Note: I’ve created a follow-up post on centering the map on the latest post.
But, like all functions, it’s not enough to define it — it must also be called. We’ll do this by modifying the body tag of index.php, like so:
<body onload="initialize()"> |
Reload your page and you should now see a map filling the window, centred on Washington DC.
Place the Markers
The way we’re going to get our markers onto the map is to:
- create a list (an array) of locations;
- specify the images we’re going to place at those locations;
- then go through (iterate) through the list, placing each one.
First up, the locations. We’re going to finish up that WordPress loop we started, where for each post we output an item in an array called “locations.” At this point we’re going to output only our “latlng” custom field, not the post title or content or any of the others. In index.php, right above the div with the ID of “map”, write this:
<script type="text/javascript"> var locations = [ <?php $i = 1; while ( have_posts() ) : the_post(); ?> <?php if ( get_post_meta($post->ID, 'latlng', true) !== '' ) : ?> { latlng : new google.maps.LatLng<?php echo get_post_meta($post->ID, 'latlng', true); ?>, }, <?php endif; ?> <?php $i++; endwhile; ?> ]; </script> |
Note: If you are using the Address Geocoder plugin, here are the first two modifications you need to make. Change the two instances of get_post_meta($post->ID, ‘latlng’, true) to get_geocode_latlng($post->ID).
Next we’ll define the images we want to use as markers. Each marker has two parts — the marker itself and its shadow, and for each you will supply paths to images of your choosing; I’ve included a couple in the ZIP, linked above, or you can use your own. Upload the images into your theme folder. At the very top of maps.js, above the initialize function, write:
var pinkmarker = new google.maps.MarkerImage('/wp-content/themes/mapdemo/pink_Marker.png', new google.maps.Size(20, 34) ); var shadow = new google.maps.MarkerImage('/wp-content/themes/mapdemo/shadow.png', new google.maps.Size(37, 34) ); |
If you are using your own images you will want to check Google’s documentation of the MarkerImage options to see what each part of these lines mean, so that you can customize them.
Note: I’ve created a follow-up post on using the post’s Featured Image as the marker.
And the final step is to loop through the locations, placing a marker for each onto the map. In maps.js, within the “initialize” function, after the “var map…” block, write:
for (var i = 0; i < locations.length; i++) { var marker = new google.maps.Marker({ position: locations[i].latlng, icon: pinkmarker, shadow: shadow, map: map }); } |
Reload your page and you should now see your marker(s) placed on the map.
Enable the Infowindow
Our last task is to create a Google Maps “infowindow” which will pop-up when a marker is clicked, showing the title and content of the post. We will do this by:
- outputting the content into a hidden div;
- referencing that div in our array of locations;
- and adding what’s known as a “click listener” to our JavaScript function to open the window.
First up, the content. This will be a a second “while” loop, immediately before the one we wrote previously. It will output a series of DIVs, each with a unique ID and containing content to be shown in the infowindow. In index.php, directly following the “matching posts” comment line, write:
<div style="display: none;"> <?php $i = 1; ?> <?php while ( have_posts() ) : the_post(); ?> <?php if ( get_post_meta($post->ID, 'latlng', true) !== '' ) : ?> <div id="item<?php echo $i; ?>"> <p><a href="<?php the_permalink(); ?>"><?php the_title(); ?></a></p> <?php the_content(); ?> </div> <?php endif; ?> <?php $i++; ?> <?php endwhile; ?> </div> |
Note: If you are using the Address Geocoder plugin, here’s the third modification you need to make. Change get_post_meta($post->ID, ‘latlng’, true) to get_geocode_latlng($post->ID).
Next add a reference to these DIVs to our locations object. Directly after this line:
latlng : new google.maps.LatLng<?php echo get_post_meta($post->ID, 'latlng', true); ?>, |
Add this:
info : document.getElementById('item<?php echo $i; ?>') |
Now define the infowindow (documentation at Google). Switch over to maps.js and, at the very top, write this:
var infowindow = new google.maps.InfoWindow(); |
Finally, add a click listener for each marker. Within the “for…” block of the “initialize” function, after the “var marker…” block, write:
google.maps.event.addListener(marker, 'click', (function(marker, i) { return function() { infowindow.setContent(locations[i].info); infowindow.open(map, marker); } })(marker, i)); |
And that’s it! Reload the page and you will now be able to click the marker(s), opening up an infowindow containing the post content. Mission accomplished!
Using the WordPress Featured Image / Post Thumbnail as a Google Maps Marker
This is a follow-up to my previous post on combining WordPress and Google Maps. Jayc asks:
“Is there any way to change the MarkerImage to the featured image for the post?”
Yes, there is!
But one thing to keep in mind is that markers are not one image but two — the marker itself and the shadow. What we’re going to cover here will show how to use the Featured Image as the marker, while continuing to use a single shadow across all posts. This means it is appropriate for markers that share the same size and silhouette.
We’ll be using the code from the previous post as the starting point. The complete example with these changes applied is also available for download from GitHub.
Initiate Featured Images
Create a new file in your theme directory, called functions.php. In it, write:
<?php // Featured Images / Post Thumbnails if ( function_exists( 'add_theme_support' ) ) { add_theme_support( 'post-thumbnails' ); } ?> |
This is the basic code. For more features see Post Thumbnails in the Codex.
When you go to your Post Edit screen you will now see a metabox called Featured Image. Clicking the link, you will be prompted to upload a file. Once you have done that, click the “Use as featured image” link (it’s next to “Insert into post”).
Make a marker declaration in the loop
We’re going to move our marker declaration into the WordPress loop. We are going to add another parameter to our locations variable, so in index.php look for the line:
info : document.getElementById('item<?php echo $i; ?>') |
And place a comma at the end of it.
Because Featured Images are not required by WordPress when publishing a post, we will test if one has been set and to provide a fallback. On the next line include the following test:
<?php if ( has_post_thumbnail() ) { ?> // There is a Featured Image <?php } else { ?> // No Featured Image, use fallback <?php } ?> |
And under “use fallback”, define a fallback image
// No Featured Image, use fallback
marker : new google.maps.MarkerImage('<?php echo get_stylesheet_directory_uri() ?>/pink_Marker.png', new google.maps.Size(20, 34) ) |
Get the path to the Featured Image
The normal way to access the post thumbnail is to use the the_post_thumbnail() function, but this returns a full img tag. We want only the image path, so let’s make our own function that does this. Open functions.php and add:
function get_thumbnail_path($post_ID) { $post_image_id = get_post_thumbnail_id($post_ID->ID); if ($post_image_id) { $thumbnail = wp_get_attachment_image_src( $post_image_id, 'post-thumbnail', false); if ($thumbnail) (string)$thumbnail = $thumbnail[0]; return $thumbnail; } } |
And back in index.php, under the “There is a Featured Image” comment, create a marker declaration that includes a call to the function:
// There is a Featured Image
marker : new google.maps.MarkerImage('<?php echo get_thumbnail_path($post->ID); ?>', new google.maps.Size(20, 34) ) |
Update the map JavaScript
Last but not least, we’ll modify the maps.js to reflect our changes. Find the line that declares the “pinkmarker”:
var pinkmarker = new google.maps.MarkerImage('/wp-content/themes/mapdemo/pink_Marker.png', new google.maps.Size(20, 34) ); |
and remove it; it’s no longer needed. Next, look for the line:
icon: pinkmarker, |
And change it to:
icon: locations[i].marker, |
And that’s it! Save everything and you should now see the featured image loaded as the marker.
Address Geocoder WordPress Plugin

A simple WordPress plugin for saving location data with Posts and Pages. Conveniently converts addresses to lat/lng from the Edit screen.
Storing addresses as lat/lng (rather than geocoding each time a user requests a page) decreases load time. This plug-in makes it easy for content managers to generate lat/lng, which is stored with the post as a custom field that can be accessed as part of the loop.
Uses the Google Maps JavaScript API V.3.
Installation and Usage
- Get a copy of the plugin from WordPress.org or Github);
- Unzip and upload it to your /plugins directory;
- Activate the plugin from the Dashboard;
- You should now find a metabox labeled “Geocoder” on your Post and Page Edit screens. Enter an address in the address field (this can be an exact address or the name of a famous place — anything Google will understand);
- Press the “Geocode Address” button;
- The Lat/Lng field will populate with a lat/lng object and a map will appear in the preview box, with a marker on the location.
Access your data in the loop using the functions get_geocode_latlng() and get_geocode_address(), with the post ID passed as a parameter. Such as:
Lat/Lng: <?php echo get_geocode_latlng($post->ID); ?> Address: <?php echo get_geocode_address($post->ID); ?> |
That’s it!
Issues and Support
If you need a hand or find a bug, please leave a comment here or, preferably, open a ticket on Github. Thanks!
Center a Google Map on the Latest WordPress Post
This is a follow-up to my previous post on integrating WordPress and Google Maps. Damien asks:
“Would it be possible to centre the map on my latest post?”
Yes, it is!
This builds off the example in the previous post and I’m using the Address Geocoder plugin to set latlngs. You can see and download the entire working example at GitHub.
Output the JavaScript with PHP
The line that defines the center of the map is presently specified in a static way — we arbitrarily chose a location and included its latlng in the JavaScript function initialize(). Now we will revise this so that it is pulling a dynamic variable from WordPress. There are a number of ways to accomplish this, but here we’re going to go with the most straightforward, which is to move the entire contents of the static maps.js into the dynamic index.php.
Open maps.js and copy the contents to your clipboard. Then open index.php and look for this line:
<script type="text/javascript" src="<?php echo get_stylesheet_directory_uri() ?>/map.js"></script> |
Remove the src parameter and paste the JavaScript between the opening and closing tags so that you have this:
<script type="text/javascript"> var infowindow = new google.maps.InfoWindow(); var pinkmarker = new google.maps.MarkerImage('/wp-content/themes/mapdemo/pink_Marker.png', new google.maps.Size(20, 34) ); var shadow = new google.maps.MarkerImage('/wp-content/themes/mapdemo/shadow.png', new google.maps.Size(37, 34) ); function initialize() { map = new google.maps.Map(document.getElementById('map'), { zoom: 12, center: new google.maps.LatLng(38.898748, -77.037684), mapTypeId: google.maps.MapTypeId.ROADMAP }); for (var i = 0; i < locations.length; i++) { var marker = new google.maps.Marker({ position: locations[i].latlng, icon: pinkmarker, shadow: shadow, map: map }); google.maps.event.addListener(marker, 'click', (function(marker, i) { return function() { infowindow.setContent(locations[i].info); infowindow.open(map, marker); } })(marker, i)); } } </script> |
Next we are going to add in a simple WordPress loop to get the single latest post and assign its latlng to a PHP variable.
Right inside the initialize() function, before the definition of map, add:
<?php $the_query = new WP_Query('showposts=1'); while ( $the_query->have_posts() ) : $the_query->the_post(); $coordinates = get_geocode_latlng($post->ID); endwhile; ?> |
And lastly, output that variable to the line that defines the map’s center, in place the static latlng. Look for this line:
center: new google.maps.LatLng(38.898748, -77.037684), |
And change it to this:
center: new google.maps.LatLng<?php echo $coordinates ?>, |
Done! On load, your map will now center on the marker of the latest post.
Origins: A User-Generated Museum Exhibit created using iPads, Google Maps and WordPress

Origins: The Birth and Rise of Chinese American Communities in Los Angeles is a permanent, cutting edge exhibition celebrating the growth and development, since the 1890s, of Chinese American enclaves from Downtown Los Angeles to the San Gabriel Valley.
Origins was designed for the Chinese American Museum, Los Angeles by THINK Jacobson & Roth. I was fortunate to be brought on as a member of the THINK team, providing start-to-finish design and development on the exhibit’s media component, Origins online. An interactive website available in the exhibit’s Monterey Park area, Origins online allows visitors to find and share great places, stories and resources of the San Gabriel Valley and other LA neighborhoods. The in-gallery presentation includes a table with two iPads for accessing the website, and a third for recording video of visitors’ own stories.
Agile Design Process, No Wireframes.

One of the earliest decisions we made on the project was to forego traditional wireframes.
The project team, consisting of CAM’s Steve Wong and Michael Truong, and THINK’s Lori Jacobson and Carla Roth, had a strong broad-strokes image of what they wanted. At our first meeting they described a map of the San Gabriel Valley, with markers indicating points of interest submitted by the public. And so, to our second meeting, I brought a working prototype demonstrating that functionality.
We continued in that vein for much of the project. At each meeting we reviewed the current state of the application and came to a consensus on development priorities for the next week. Feeling our way forward, we’d field lots of ideas and implement those with the highest priority. This process reminds me of the saying, “crossing the river by stepping on stones.”
Rather than discussing abstractions and hypotheticals, this approach allowed us to base our decisions on real experiences with a working interface. And rather than spending our limited time producing paper documents such as wireframes and mockups, all our effort went toward expressing ideas in code that could be poked, prodded, tested and, ultimately, launched.
“When Marty proposed working without wireframes, I immediately responded positively to this idea. With a tight budget and a hands-on client, working with iterative prototypes was the way to go. Rather than lingering in pre-production, this allowed us to quickly make team decisions and try things out in a very real way.”
— Carla Roth
At about the two-thirds mark we took a step back and presented our work, and the decisions it embodied, to Executive Director Michael Duchemin, who gave it his blessing. As the physical exhibition took shape we took a break, and by the time we reconvened the launch date had begun to loom large. So we locked development on new functionality and turned our focus to fit and finish.
I proposed that, since the site would be presented in-gallery using iPads, we adopt the iOS design vernacular. Applying gradients, highlights, textures and pop-overs would involve adding substantial complexity to the code, however, and increase the cost-of-change. For this reason we decided it was finally appropriate to create a mock-up and secure a more traditional client sign-off. From there we turned to browser testing and bug barbecue, then finished with the physical installation and documentation.

Google Maps + WordPress + iPads
Curator Steve Wong described his own extensive use of Google Maps in charting the region’s activity and history, and imagined enabling something similar for the community. I had previous experience with the Google Maps Javascript API so was able to hit the ground running. We chose WordPress for the CMS because of its ease-of-use for both development and content management. Additionally, I knew that the Gravity Forms plugin would allow us to fulfill the user-submission aspect of the project. And we chose Media Temple to host based on the suitability of their offering and my own familiarity with their setup. (Their location in Los Angeles was a bonus!)
The implementation’s core technical concept is described in my WordPress + Google Maps tutorial. Also, this project was the original motivator for the Address Geocoder WordPress plugin, which is now available from the WordPress plugin directory. The other aspect of the technical challenge was creating a JavaScript-heavy site that would look its best on 3rd generation iPads running the Kiosk Pro browser, while also performing on the desktop.
I’m happy to answer questions regarding the technical aspects of this project, including the Google Maps API, WordPress or, more generally, our agile approach and deploying web-based museum exhibits using iPads. Questions about the overall exhibit should be directed to THINK Jacobson & Roth.
The Chinese American Museum is a great space with a ton of history and a staff truly committed to serving their community and preserving its heritage. If you’re in LA, go see the exhibit!
Goshka Macuga microsites for the Museum of Contemporary Art Chicago
This post is a collaboration between Sarah Wambold and Marty Spellerberg. Sarah Wambold is a Denver-based project manager and documentary producer. Marty Spellerberg is an Austin-based interactive media designer/developer.
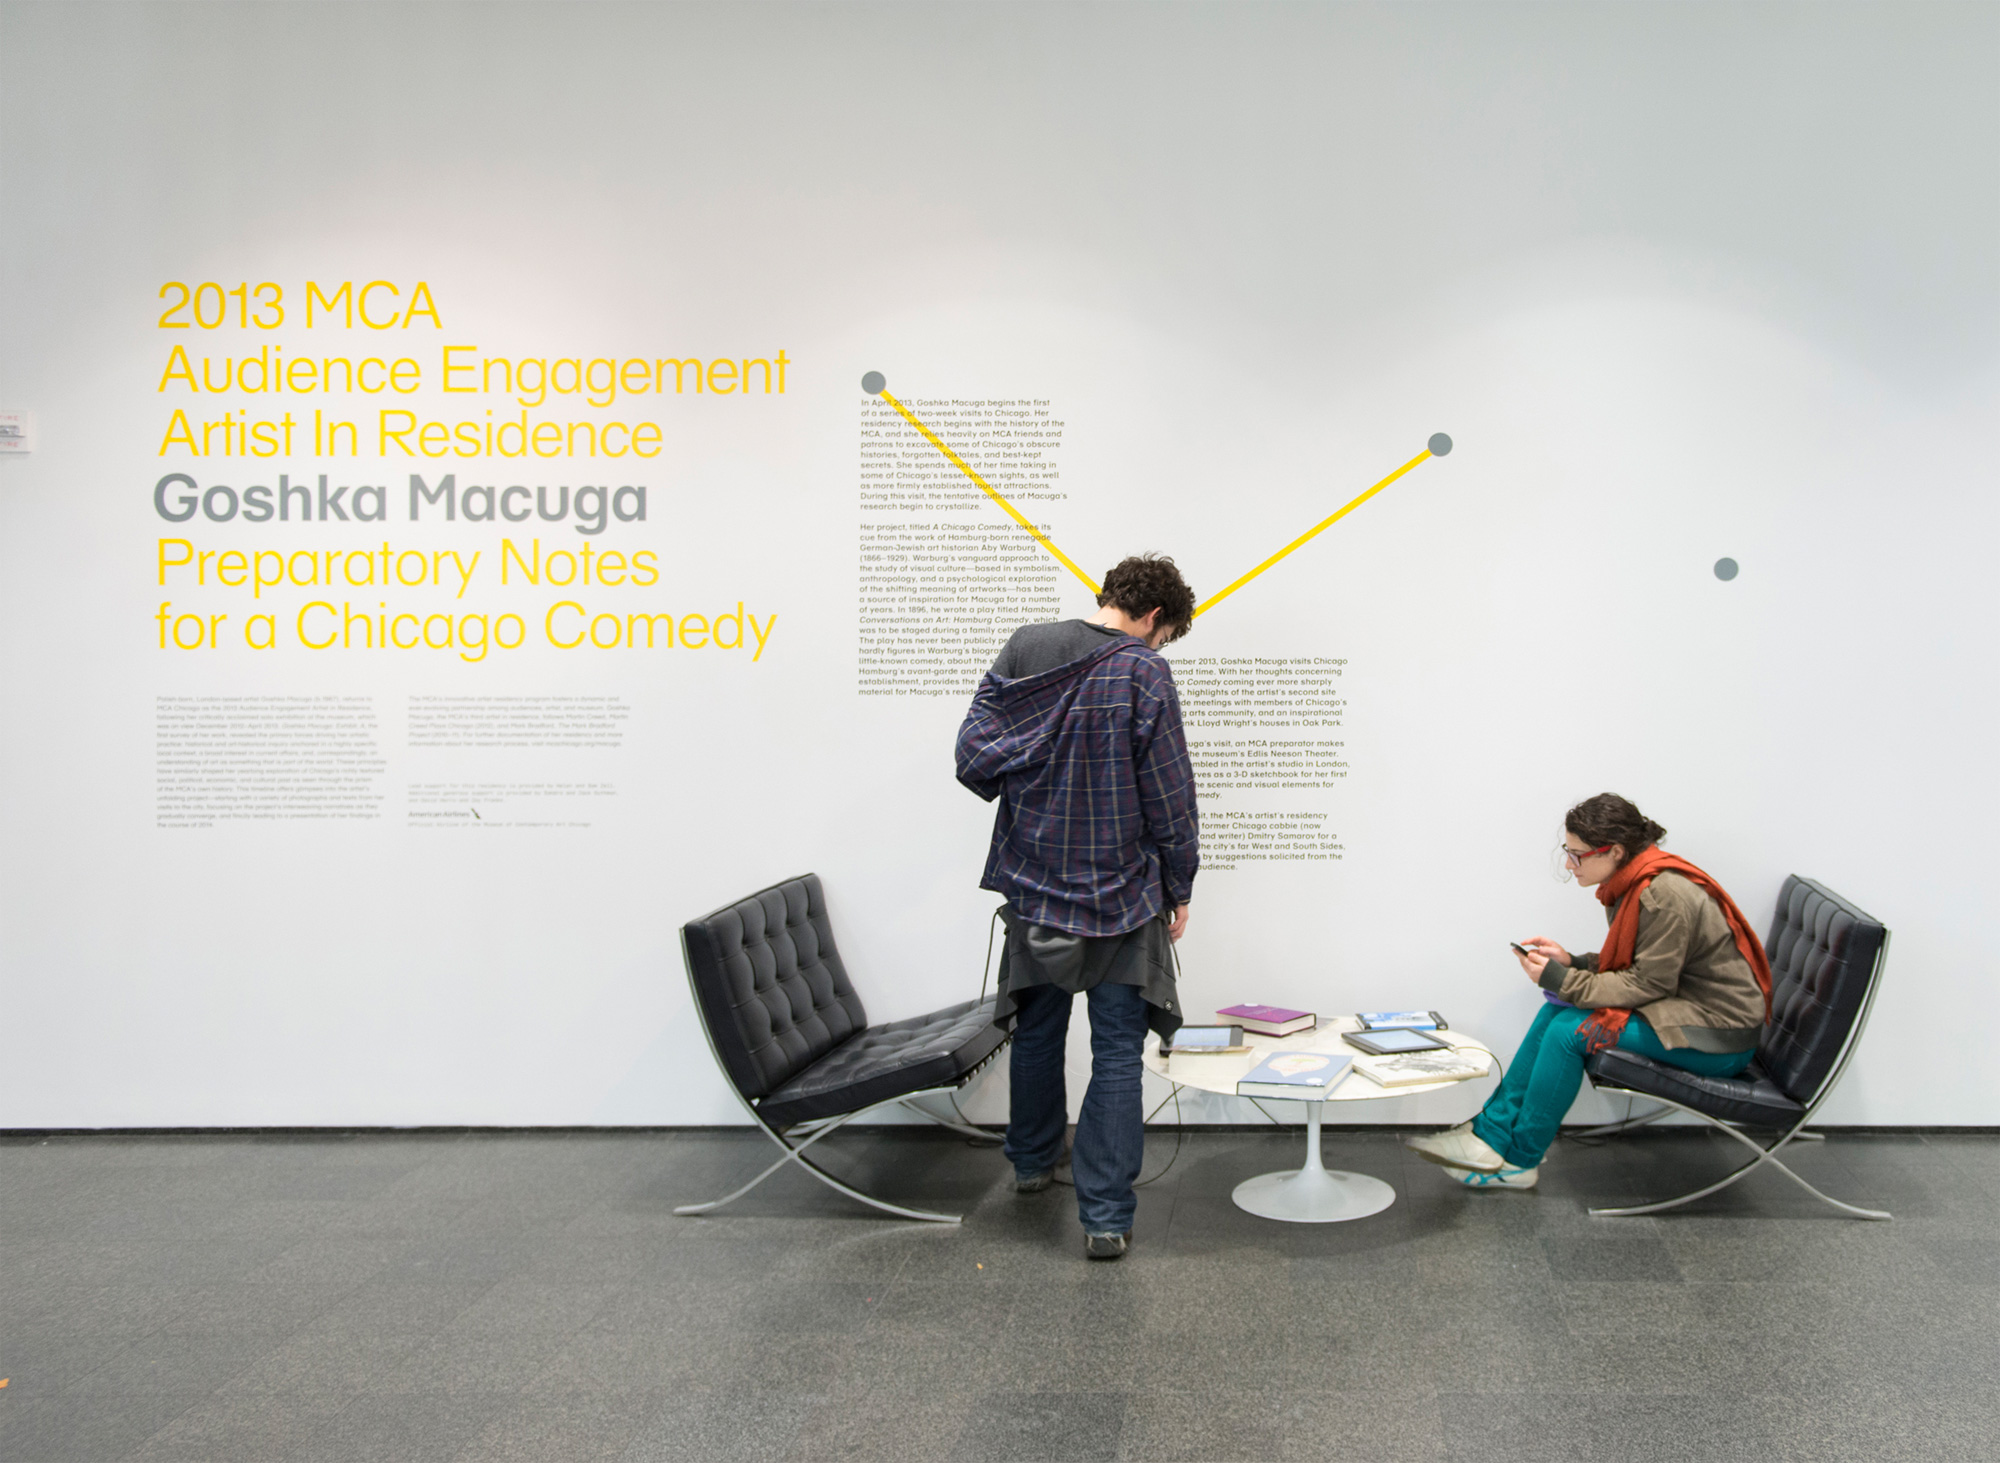
Goshka Macuga is the MCA Chicago’s 2013 Artist In Residence.
“Macuga’s work interweaves two strands that have helped define contemporary art in the last decade: artists’ increasing tendency toward historical and archival research and their growing interest in strategies of display and the dialogue between artistic and curatorial practice.”
— Dieter Roelstraete
Inspired by Hamburg Conversations on Art: Hamburg Comedy, a 1896 work German Jewish art historian Aby Warburg, Macuga’s residency project is to create a Chicago Comedy. But because the resulting work, likely to be a play, will not exist until the end of the term, the artist’s process is being documented and presented to the public as Preparatory Notes for a Chicago Comedy. Our team became involved as interactive media designers/developers.
With no artist on site—she’s in London—and no objects being produced in the early phases, how would museum visitors know there was, in fact, a residency taking place? We needed a physical manifestation or marker that would let the public know what was happening as it was happening.
In-Gallery iPad Kiosk
The artist was opposed to creating a object or an installation “as a placeholder,” so digital, with its ability to present a depth of information in a physically economical and engaging way, emerged as the best candidate. iPads as part of a title wall installation became the solution for a physical, onsite manifestation of the residency.
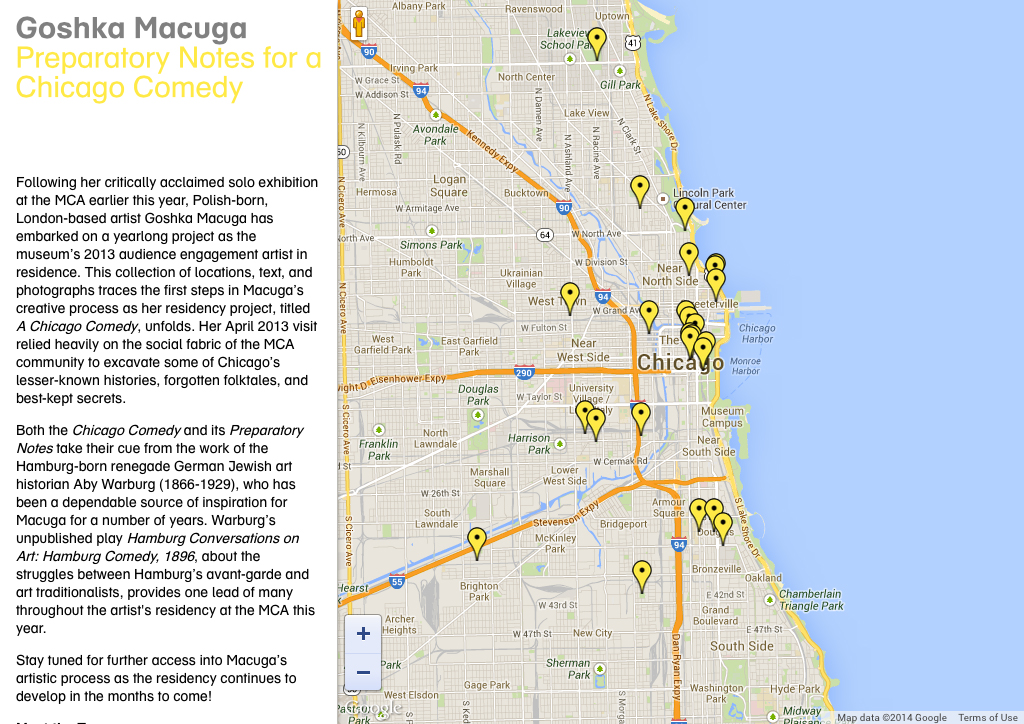
Early in the year, Macuga was joined by MCA Curator Dieter Roelstraete for a romp around the city, seeking to “excavate Chicago’s lesser-known histories, forgotten folktales, and best-kept secrets.” The material they generated became the basis for our presentation.
Since the artist’s notes were organized around places she visited around the city, we chose an interactive map interface. This provided an instantly relevant format: Onsite visitors are, by definition, present in Chicago and likely to relate to a map of the city. This also served to emphasize the project’s connection and relevance to the local community, a goal of the Museum’s residency program generally.
The technical solution was based on the technique demonstrated in Marty’s Integrating WordPress and Google Maps tutorial, which he previously used to create an in-gallery kiosk for the Chinese American Museum, Los Angeles.
Museum Website
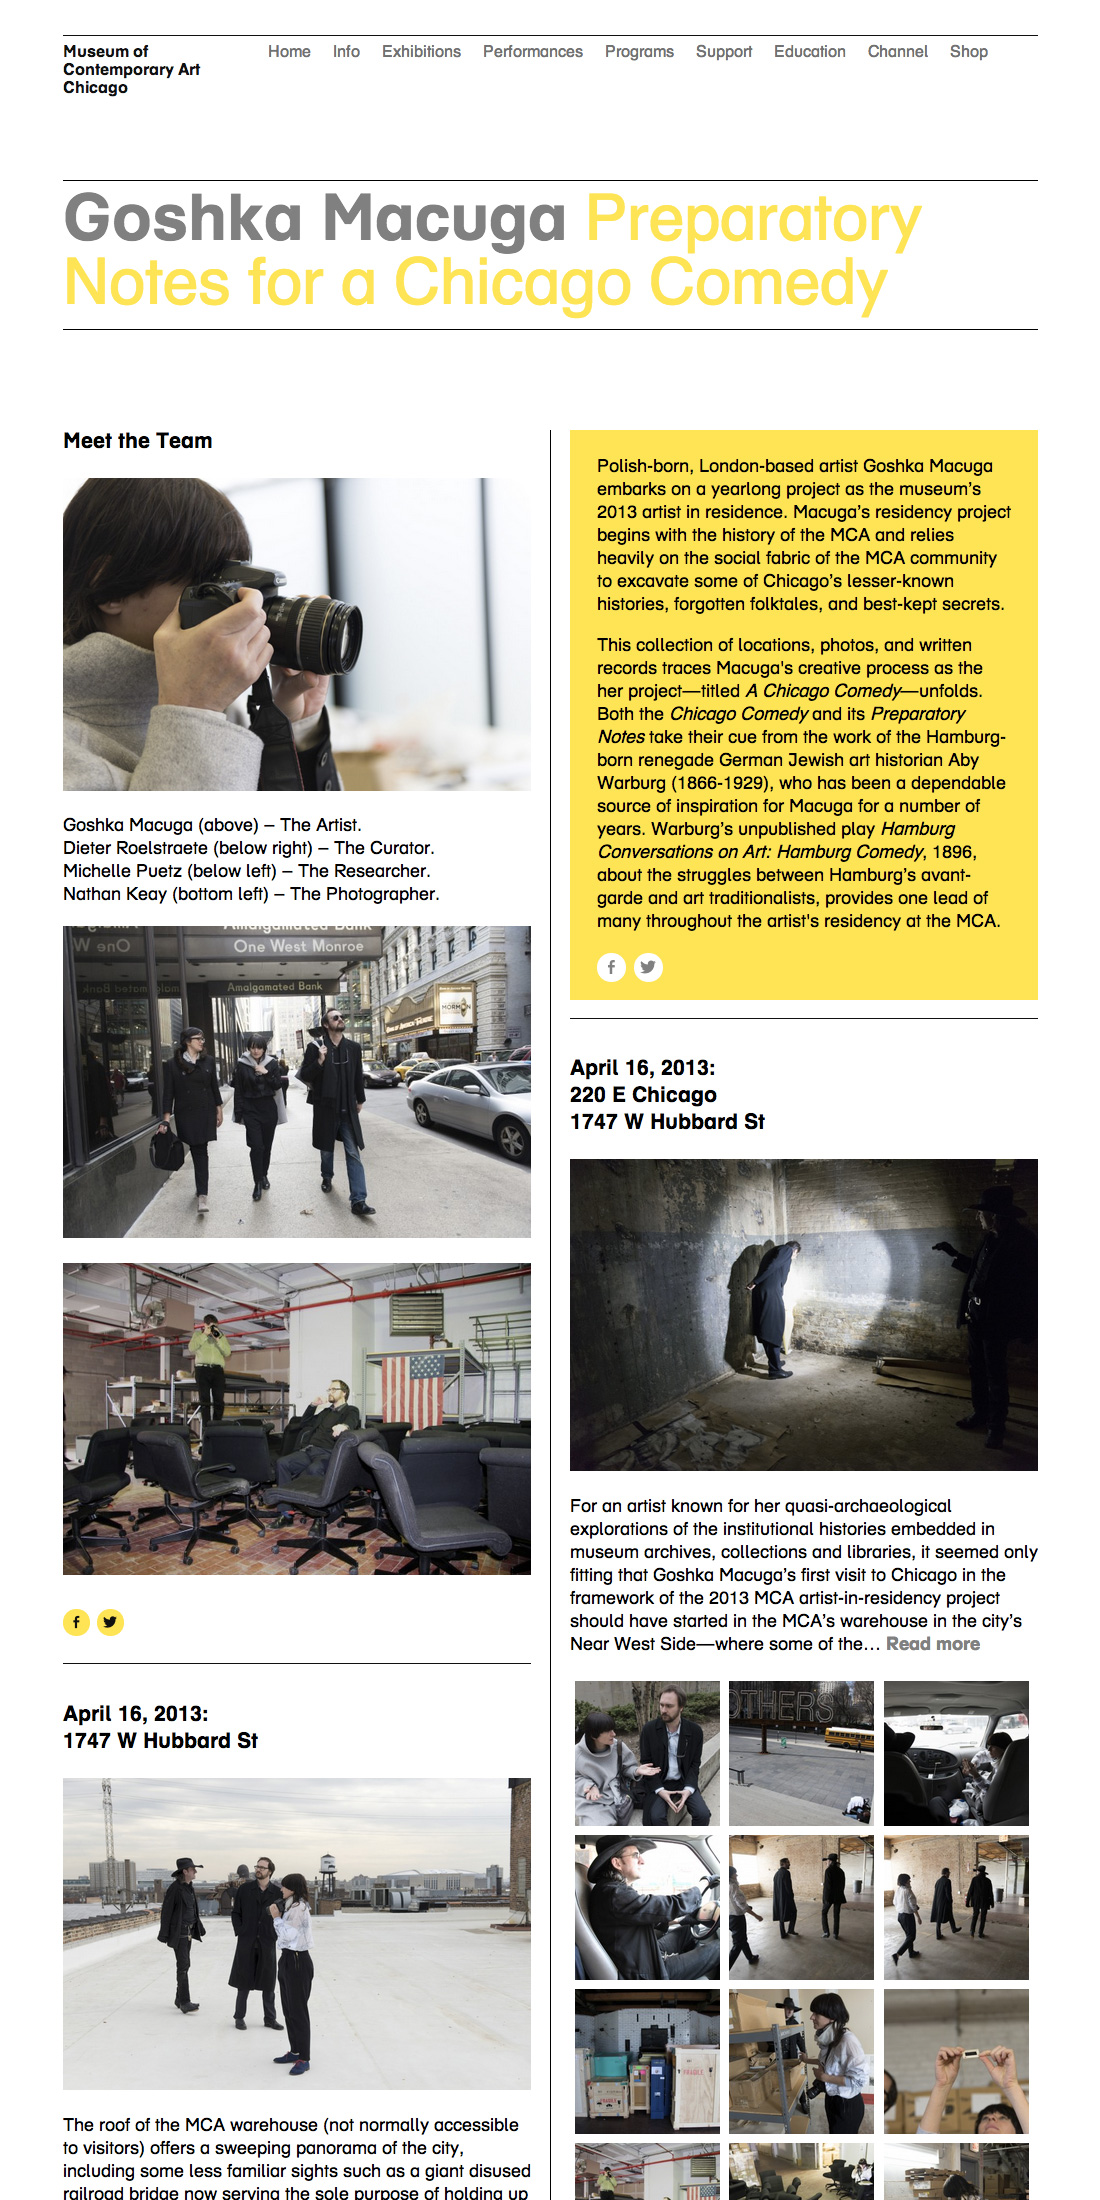
We also wanted to put something online that could live-on once the residency itself is completed. We realized, over several discussions with the curator, that Macuga’s work would find its form in phases: Lateral research of canvassing Chicago; vertical research of deep dives at the Warburg Institute; production, likely to happen abroad; and a to-be-determined final presentation. The digital strategy would need to respond to each of these.
We recognized that the map interface would be inadequate for telling the rest of the story of the residency; as Macuga moved from research-based activities, some happening abroad, and into production, using a map to navigate the content would no longer make sense.
The Museum had a history of stand-alone project blogs, and we made the choice to continue that format in this case. The first thing we did was to consolidate the most recent blogs under a unified banner and feed, which improved the prospects for long-term maintenance, as well as providing added context for future researchers. But we also wanted to provide a unique feel specific to the here-and-now, so we designed a two-column landing page using the Packery layout library.
The project was driven by a core creative concept that came into view over a period of time, as the artist’s process revealed the characteristics of the artwork she is creating. By adopting an agile design and development methodology, our team was able to respond to the changing needs for the project mid-course. The result was a compelling, revealing and engaging presentation for Museum visitors both onsite and online.
Project Collaborators
Digital Team
Producer and Project Manager: Sarah Wambold
Designer and Developer: Marty Spellerberg
Content Coordinator: Marian Oman
Residency Team
Project Manager: Erika Hanner
Curator: Dieter Roelstraete
Content Creators: Michelle Puetz, Dieter Roelstraete, and Goshka Macuga