Visitor Motivation
Understanding Museum Website Visitor Motivation using Google Analytics
This post is a collaboration between Sarah Wambold and Marty Spellerberg. Sarah Wambold is a Denver-based project manager and documentary producer. Marty Spellerberg is an Austin-based interactive media developer.
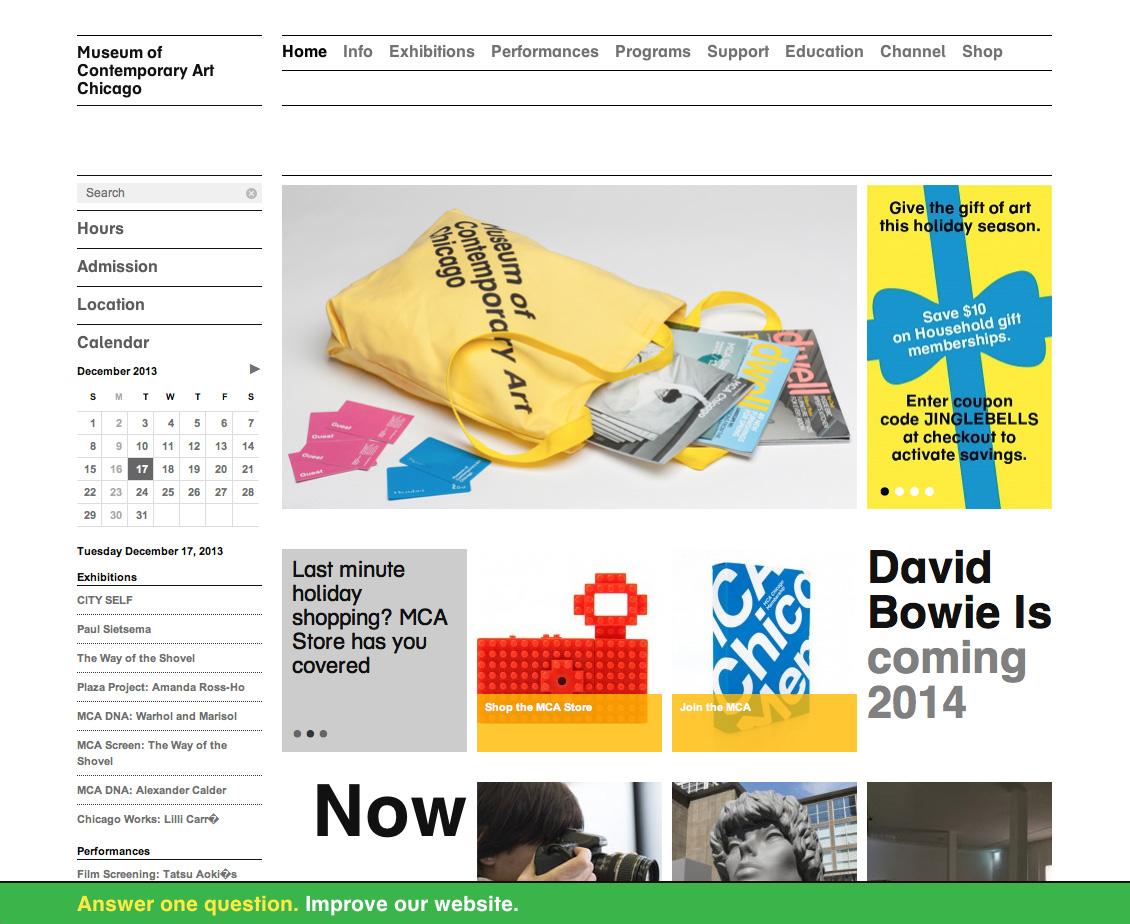
Google Analytics is a powerful tool for understanding traffic to a website. The standard site statistics, however, don’t always tell the full story.
For instance, interpreting the duration of an average site visit is highly speculative. It is typically thought that the longer a visitor spends on the site the better, and that shorter interactions are less successful. But this is not necessarily the case.
Take a visitor who comes to the site looking for the museum’s hours. If she was able to quickly and efficiently locate the information she needed, this interaction should be considered positive, despite the short visit duration. Conversely, if she was unable to find the information and had to search for a longer amount of time to find the information, the long duration would signal that the interaction had been considerably less successful in this instance.
A combination of survey techniques is necessary to overcome this reporting challenge and understand the successes, shortcomings, and opportunities of a Museum’s website.
Augmenting the Standard Stats
Working with the Museum of Contemporary Art Chicago, we wanted to increase our insight into how the site was being used. We knew that, in order to analyze current and inform future online offerings, we needed to be able to identify which kinds of users were accessing the site. Are there, in fact, different motivations for visitors to come to the MCA’s site? If so, how do those groups differ in their use of the site? To gain this information, we conducted a Visitor Motivation Survey.
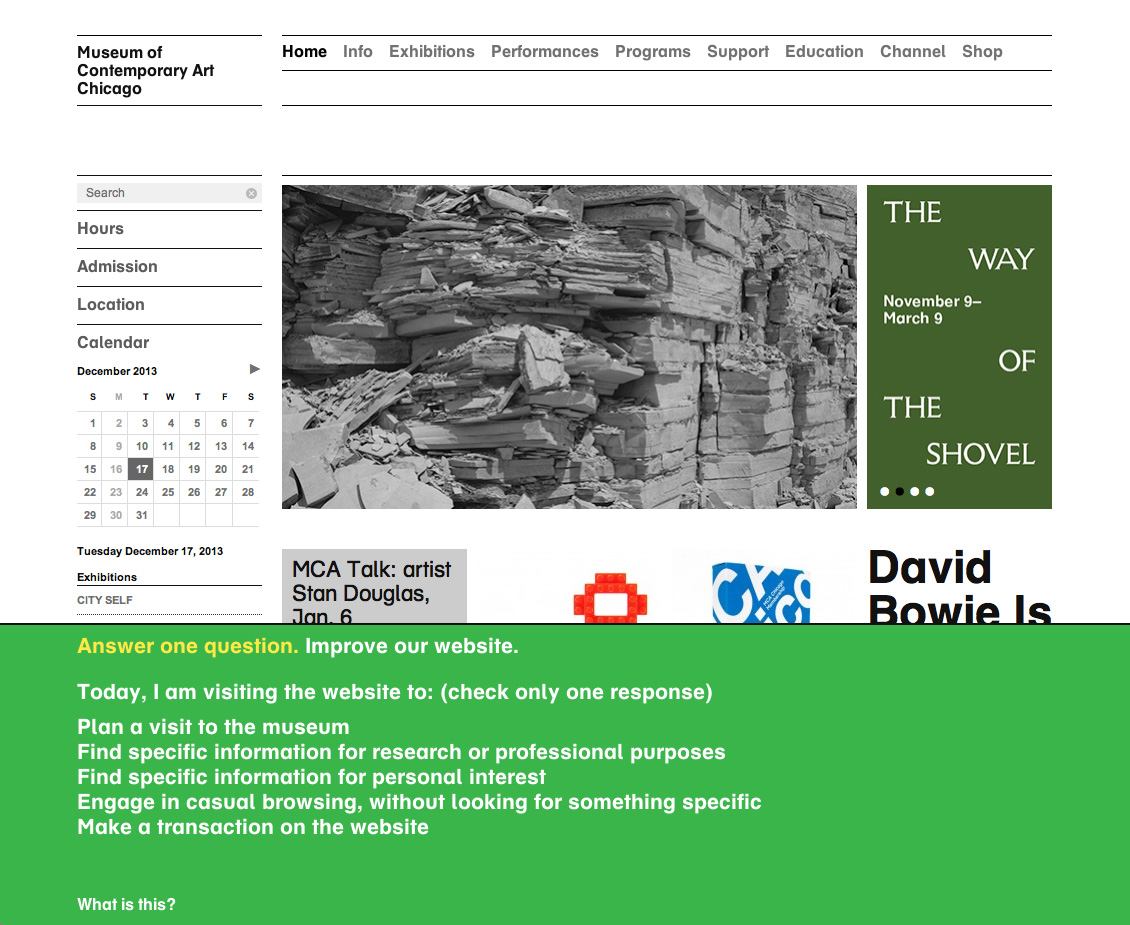
We modeled our survey after a study by the Indianapolis Museum of Art. We placed a one-question survey on the homepage, asking visitors to the site to self-identify into one of five user groups based on why they were visiting the site that day. Assuming IMA’s methodology, the choices we presented were:
- Plan a visit to the museum
- Find specific information for research or professional purpose
- Find specific information for personal interest
- Engage in casual browsing, without looking for something specific
- Make a transaction on the website
The visitor’s choice was synced with Google Analytics, using a custom variable to tie it to the record of their browsing session. This allowed us to model activity across the site, segmented by motivational category.
Comparing Engagement Levels
By requiring participants to interact by answering the survey question, we could infer a minimal level of engagement with the site. We segmented this group of “engaged visitors” from those users who may have found themselves on the site erroneously. Comparing these samples allowed for a more informed analysis of site traffic overall.
The survey launched on Nov 4, 2013, and collected responses for 16 weeks, receiving 1,086 responses in total. A report based on the first eight weeks yielded revealing insights into the MCA’s online audiences.
Analysis of the survey data identified which motivation groups are most likely to return to the site, and the content these types of users are seeking to engage with. The Museum is now able to apply this information in a strategic content plan aimed at generating increased repeat visitation and overall site traffic.
Project Collaborators
Producer and Project Manager: Sarah Wambold
Designer and Developer: Marty Spellerberg
Shoutout/thanks to Gray Bowman for sharing code from the IMA’s implementation.
Introducing the National Museum Website Visitor Motivation Survey
I’m leading, with collaborator Sarah Wambold, a nationwide study into the motivation of visitors to museum websites. As of this writing we have 22 participating institutions, including representatives in Canada and Australia.

Background
Google Analytics is a powerful tool in understanding traffic to a website, but site statistics alone do not always tell the full story. A combination of techniques is necessary to gain insight into why visitors come to a museum’s website, which are more likely to return, and how different types of visitors consume the content they find there. One such technique is a Visitor Motivation Survey (VMS), such as the one presented at MW 2012 by the Indianapolis Museum of Art. Using their method, online visitors are presented with a one-question survey that asks them to specify why they’ve come to the website that day. Custom variables are used to track responses in Google Analytics. This allows site traffic to be segmented by responses, thereby allowing site activity to be tracked by motivational category. Sarah and I conducted a survey of this kind for the MCA Chicago in 2014.
In his book Identity and the Museum Visitor Experience, researcher John Falk outlined a predictive model of visitor experience designed to help museum professionals better meet their visitors’ needs. Drawing upon a career studying museum visitors, he identified five key types of visitors who attend museums and the internal motivations that drive repeat visitation: Experience Seeker; Explorer; Socializer; Recharger; Hobbyist / Professional. (I’ve previously made use of Falk’s framework in the redesign of the Santa Cruz MAH’s homepage.)
A Wide Survey
Our project is simultaneously surveying a myriad of museum websites, pairing an IMA-style Google Analytics-powered backend with segments adapted from Falk’s motivation framework. Since the IMA’s 2012 presentation, studies following IMA’s methodology have been reproduced at various institutions. In addition to the use of Falk, our project is distinct in that it looks at the data in aggregate and provides representatives from participating museums the opportunity to discuss their findings, highlighting patterns that emerge across the various institutions. In seeking to identify trends across the sector, we hope to identify best practices for each motivation and enable participants gain an understanding the similarities and differences in their audiences. Participating institutions include:
- Art21
- Art Gallery of Ontario
- Aspen Art Museum
- Chicago Architecture Foundation
- Chinese American Museum Los Angeles
- Clockshop
- Clyfford Still Museum
- Contemporary Art Museum St. Louis
- de Young Museum (soon to be launched)
- Hammer Museum (soon to be launched)
- Houston Center for Contemporary Craft (soon to be launched)
- Institute of Contemporary Art/Boston
- Illinois Holocaust Museum
- The Menil Collection
- Santa Cruz Museum of Art and History
- Museum of Contemporary Art Denver
- Nasher Museum of Art at Duke University
- Nasher Sculpture Center
- Portland Art Museum
- Powerhouse Museum
- Warhol Museum
- Yerba Buena Center for the Arts
Cross-Platform Roll-out
I developed the survey’s implementation, consisting of HTML, CSS and JS files that together create a user interface for the VMS. Along with supporting documents, I packaged the sample code as a WordPress plugin, which was posted to a GitHub repo for easy access by developers at the various institutions. This was soon joined by a Drupal 7 adaptation, put together by Chris Brown of the Yerba Buena Center for the Arts and further modified by Andrew Fox at the Fine Arts Museums of San Francisco.
The initial batch of institutions rolled-out the survey in November and December of 2015. Additional institutions continue to join the survey and come online.
Online Professional Forum
As we enter the analysis phase of the project, we’re hosting an online forum for participants via Slack. This is where we share important project information and training and, most critically, it’s where representatives make connections with their counterparts at other institutions, discuss objectives, and share results.
As results are developed in the forum we’ll be taking advantage of opportunities to share our learnings and insights with the broader sector. Stay tuned!
Presentations at MW 2016

I’m proud to announce that I’ll be presenting at Museums and the Web this year. I’m involved in two sessions:
The first is Visitor-First, Mobile-First: Designing a Visitor-Centric Mobile Experience, part of part of the User-Centered Design session, chaired by Michael Parry of the Powerhouse Museum. In this panel Elise Granata and I’ll be presenting on our work redesigning the homepage of the Santa Cruz MAH (which I’ve posted about here). We’ll be joined by Sarah Wambold, of the Clyfford Still Museum, who’ll expand on the adaptation of John Falk’s visitor motivation research to the type of user personas used in UX design. The three of us collaborated on a paper, which has been published online.
The second is Falk Meets Online Motivation: Results from a Nationwide Survey Project, part of the Lightning Talks: Practice series, chaired by Nik Honeysett of the Balboa Park Online Collaborative. In this session, Sarah Wambold and I’ll be giving an introduction to the National Museum Website VMS project (which I’ve posted about here).
These projects are very much connected, the later growing out of the former, so it’s great to have this opportunity to present them both. This year’s conference is taking place April 6-9, 2016 at the Millennium Biltmore Hotel in Los Angeles. See you there!
Presentation at MW 2016: The National Museum Website Visitor Motivation Survey
I had the honor of presenting an introduction to the National Museum Website Visitor Motivation Survey project at the 2016 Museums and the Web conference in Los Angeles. I shared this honor with my project co-leader, Sarah Wambold, Director of Digital Media at the Clyfford Still Museum. What follows are the slides and speaking notes from our presentation.
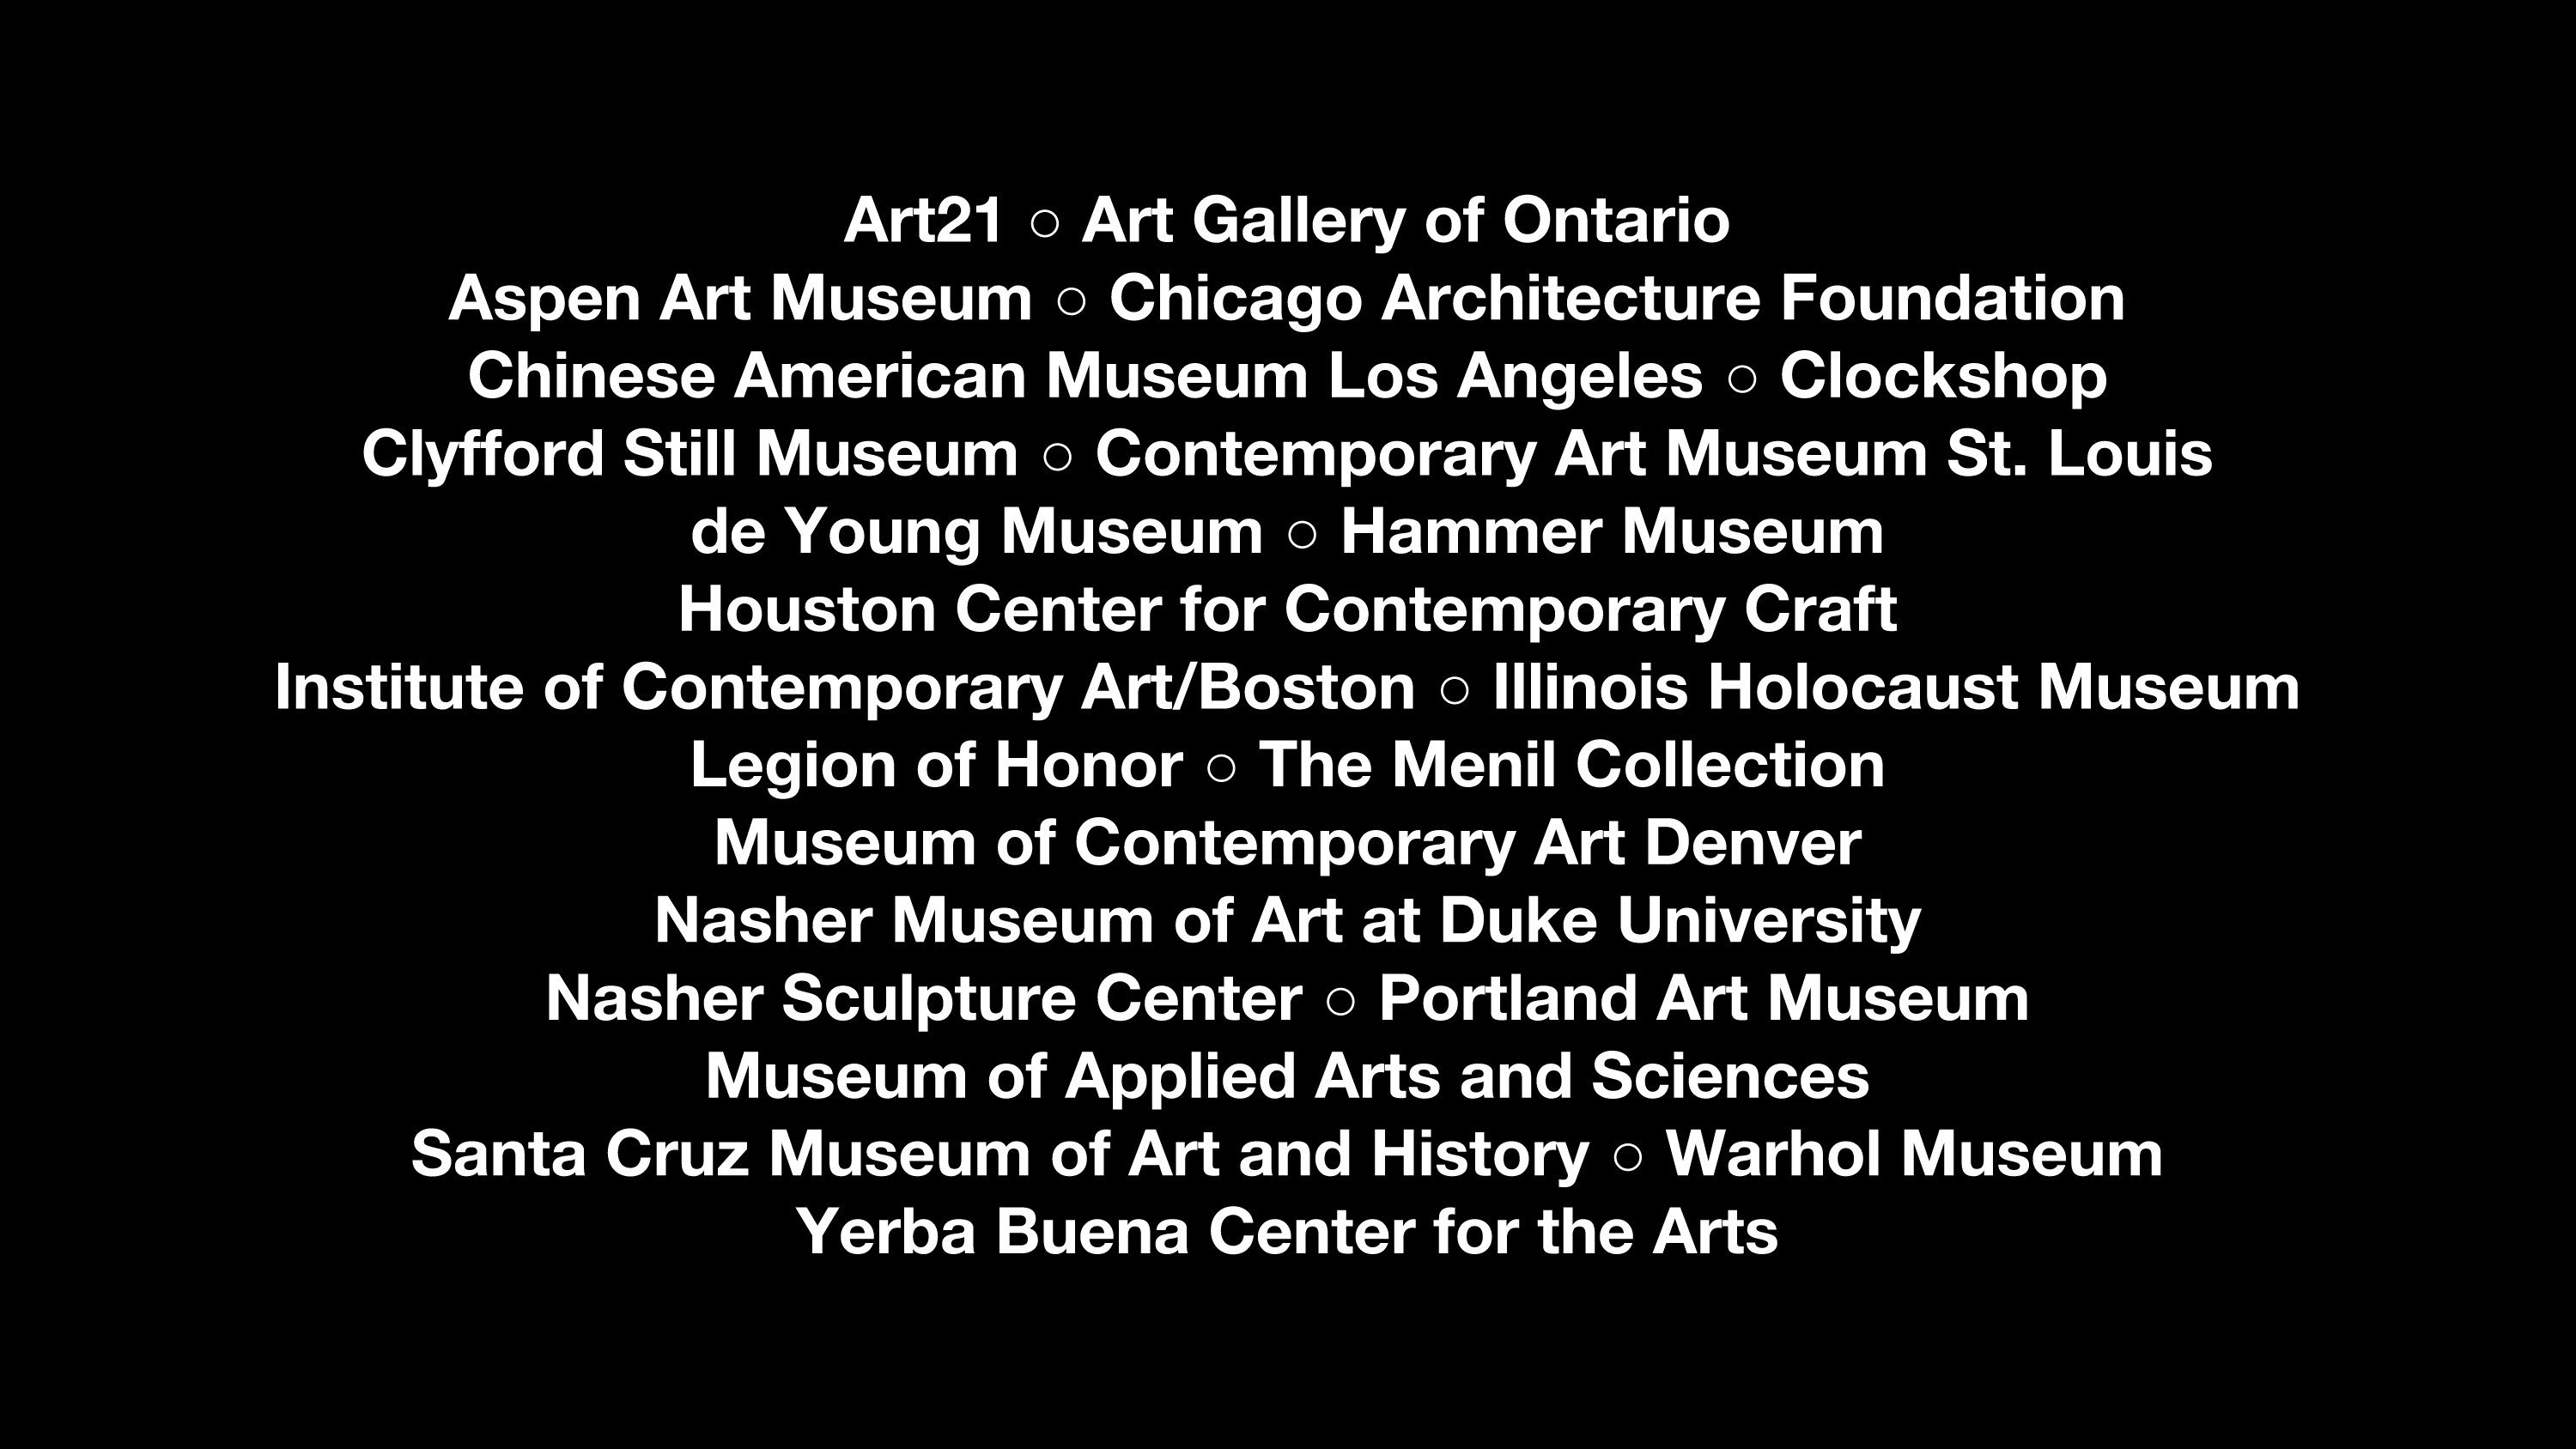
We are conducting a study with two dozen museums and cultural organizations across the country.
The project surveys the motivations of visitors to museum websites, based on the framework of visitor motivation developed by museum researcher John Falk. The quantitative data is collected through each institution’s Google Analytics account.
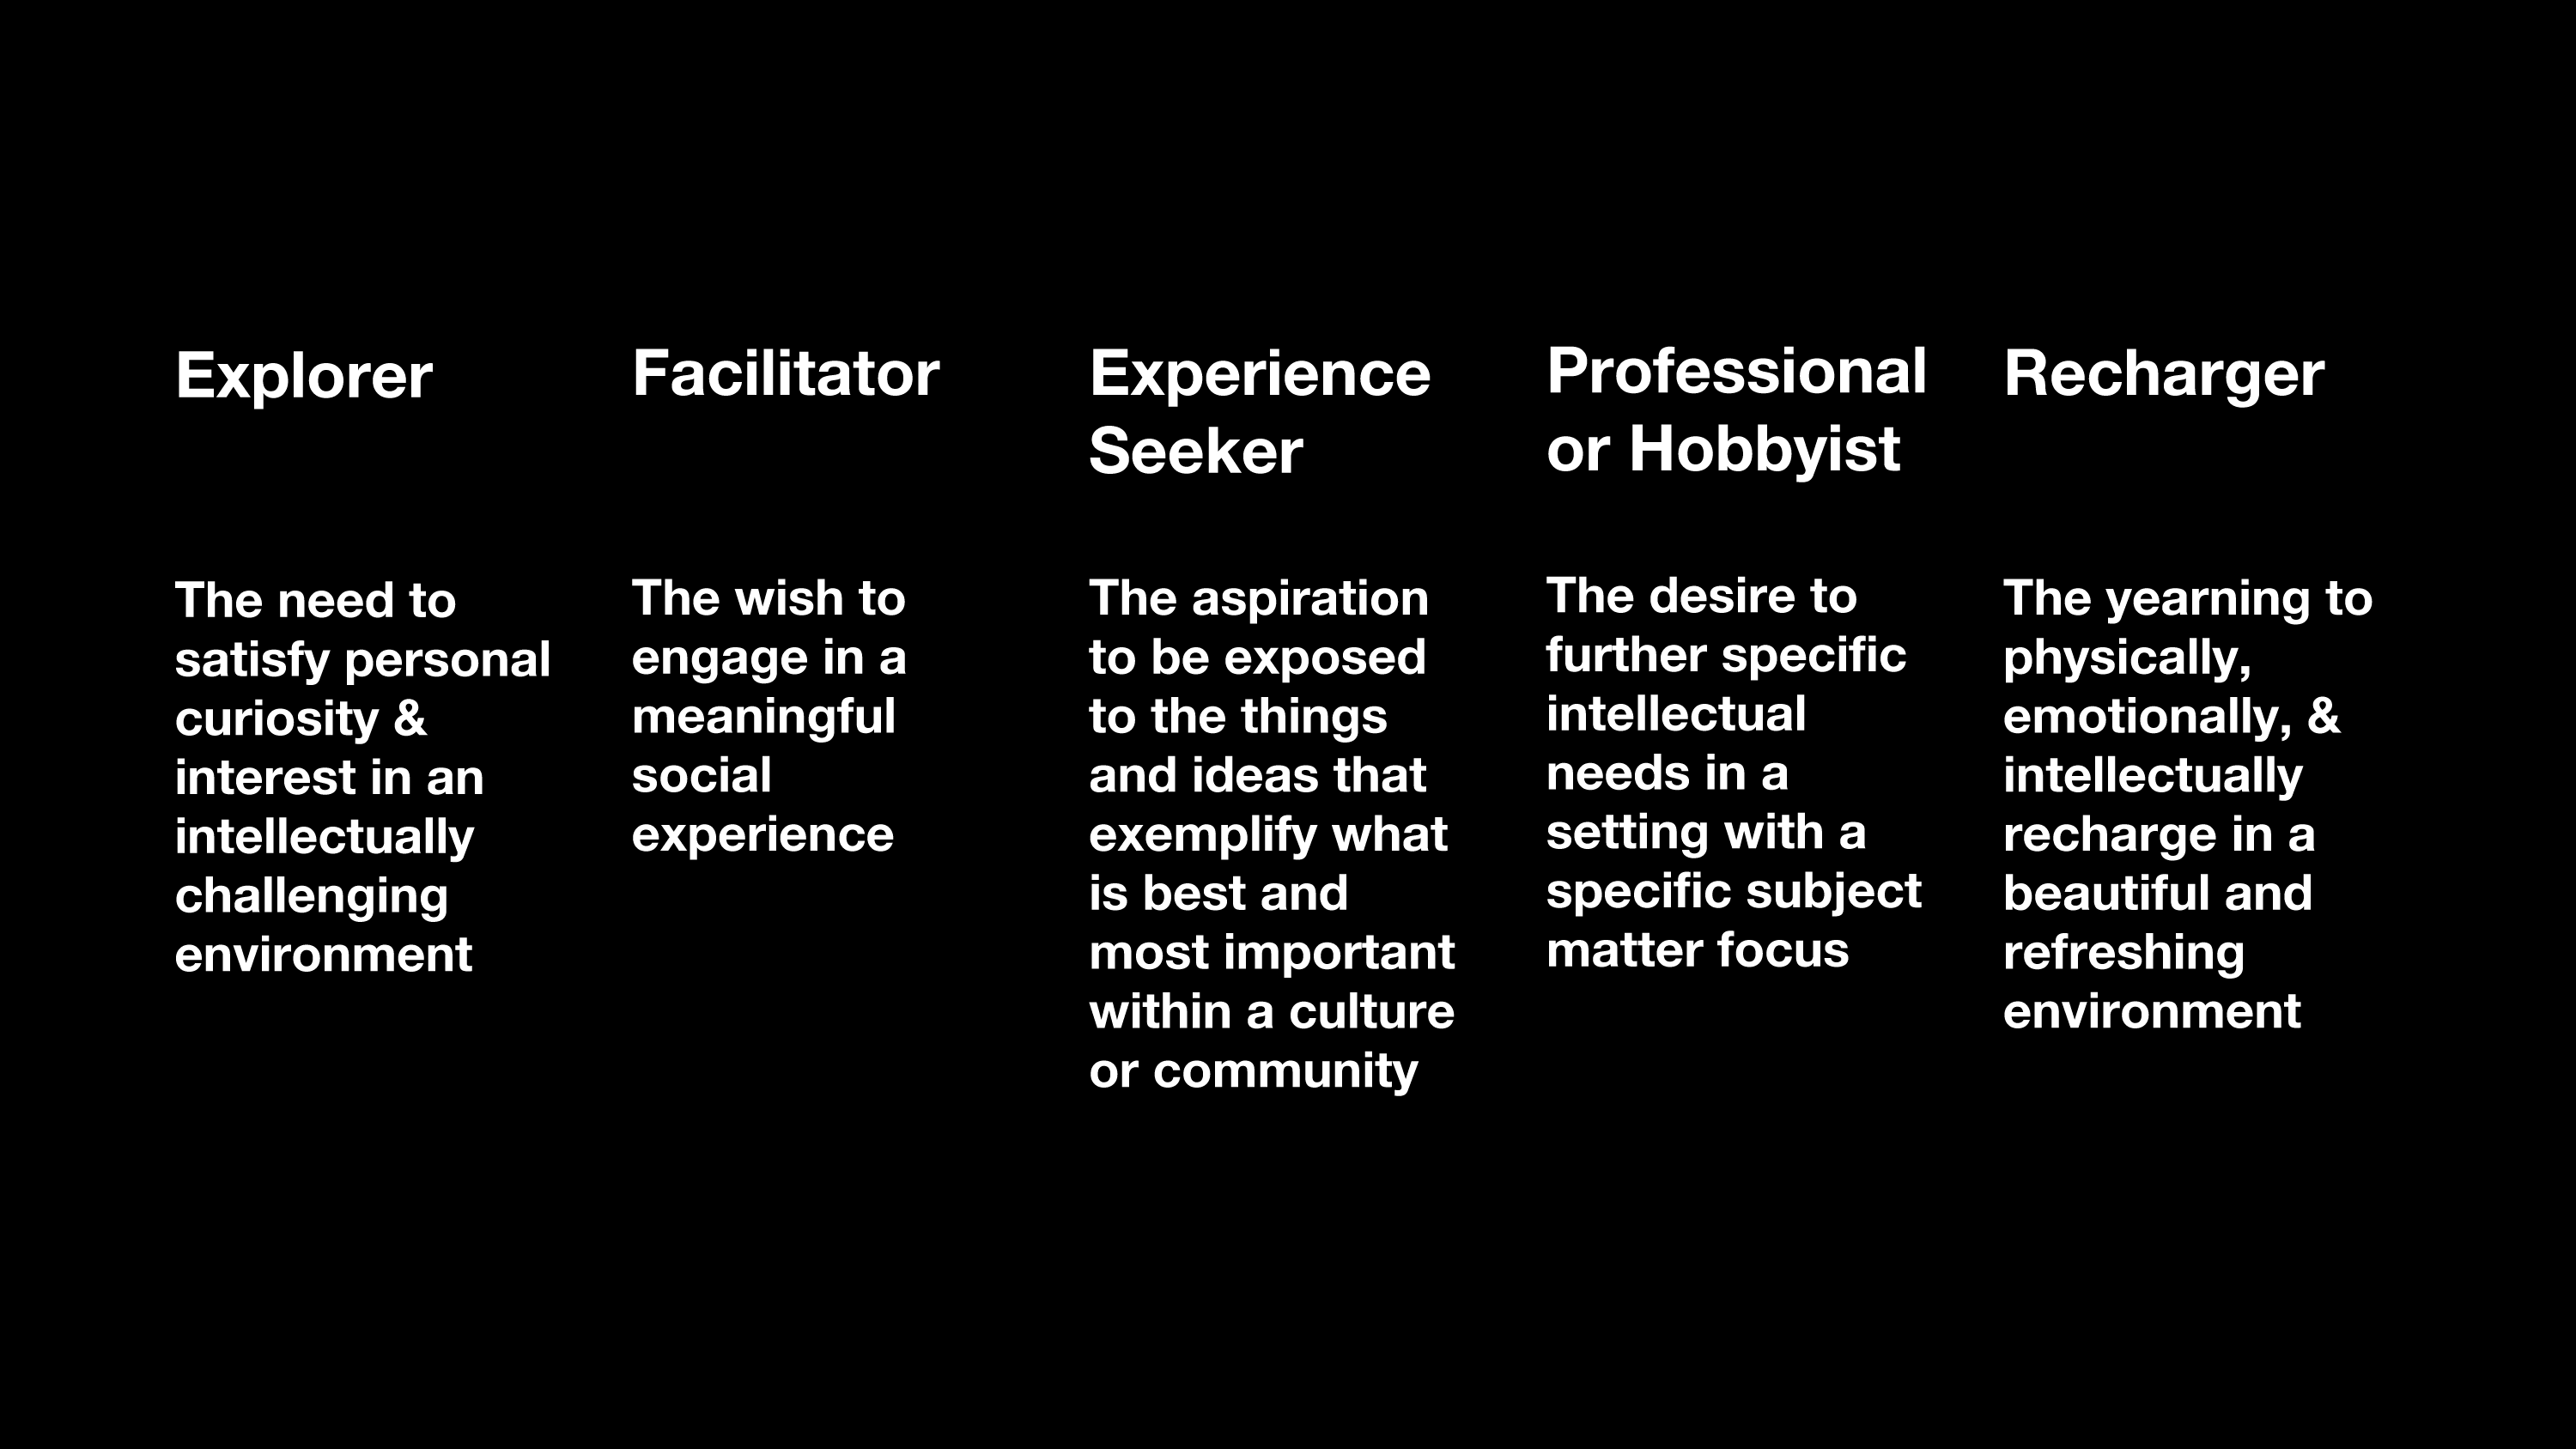
In his book Identity and the Museum Visitor Experience, Falk identifies five key types of visitors who attend museums and the internal motivations that drive repeat visitation. These motivations are Explorer, Facilitator, Experience Seeker; Professional/Hobbyist; Recharger.
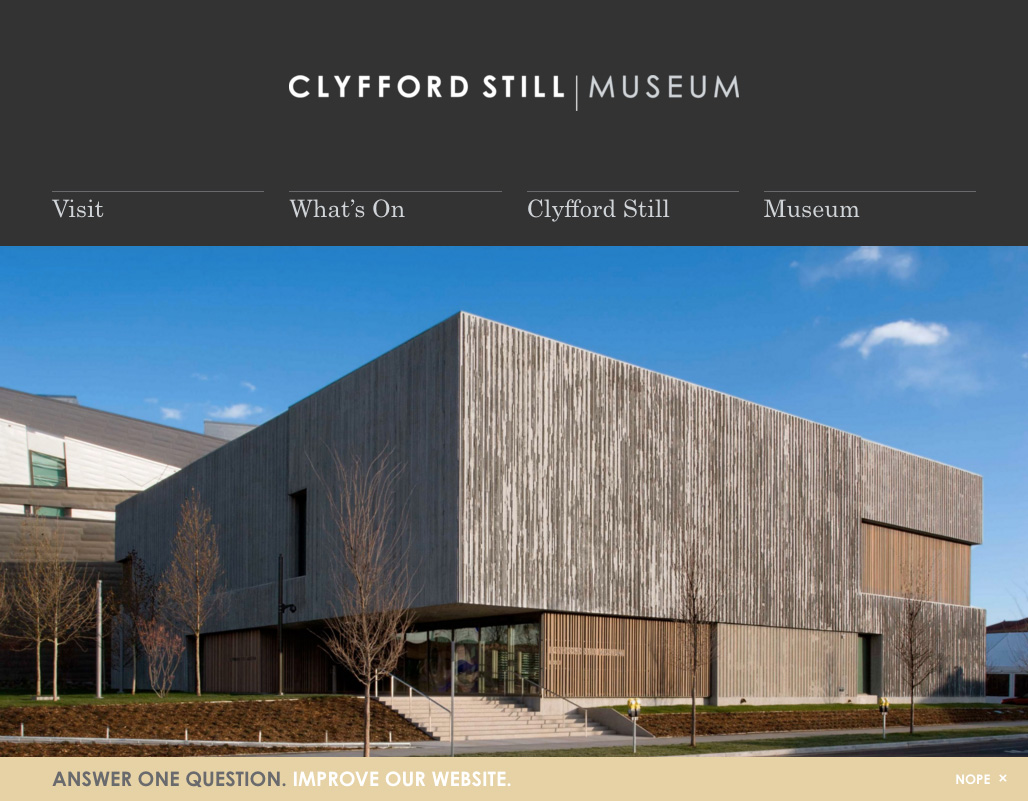
This is what the survey looks like. It appears on every page of the website, pinned to the bottom of the window. Users click it and it opens up.

The survey options are consistent across every institution. But the fonts and color are customized to match the individual site’s design.
The technical implementation is similar to the one used in a website visitor motivation survey by the Indianapolis Museum of Art. That survey was presented here at MW in 2012.
Here’s how it works. First, we configure the Google Analytics account with what’s called a “Custom Dimension.” We then install the VMS user interface on the site. This consists of snippets of HTML, CSS and JavaScript.
We have a version of the code packaged as a WordPress plugin, and a version packaged as a Drupal module. The underlying survey code can be adapted to any platform.
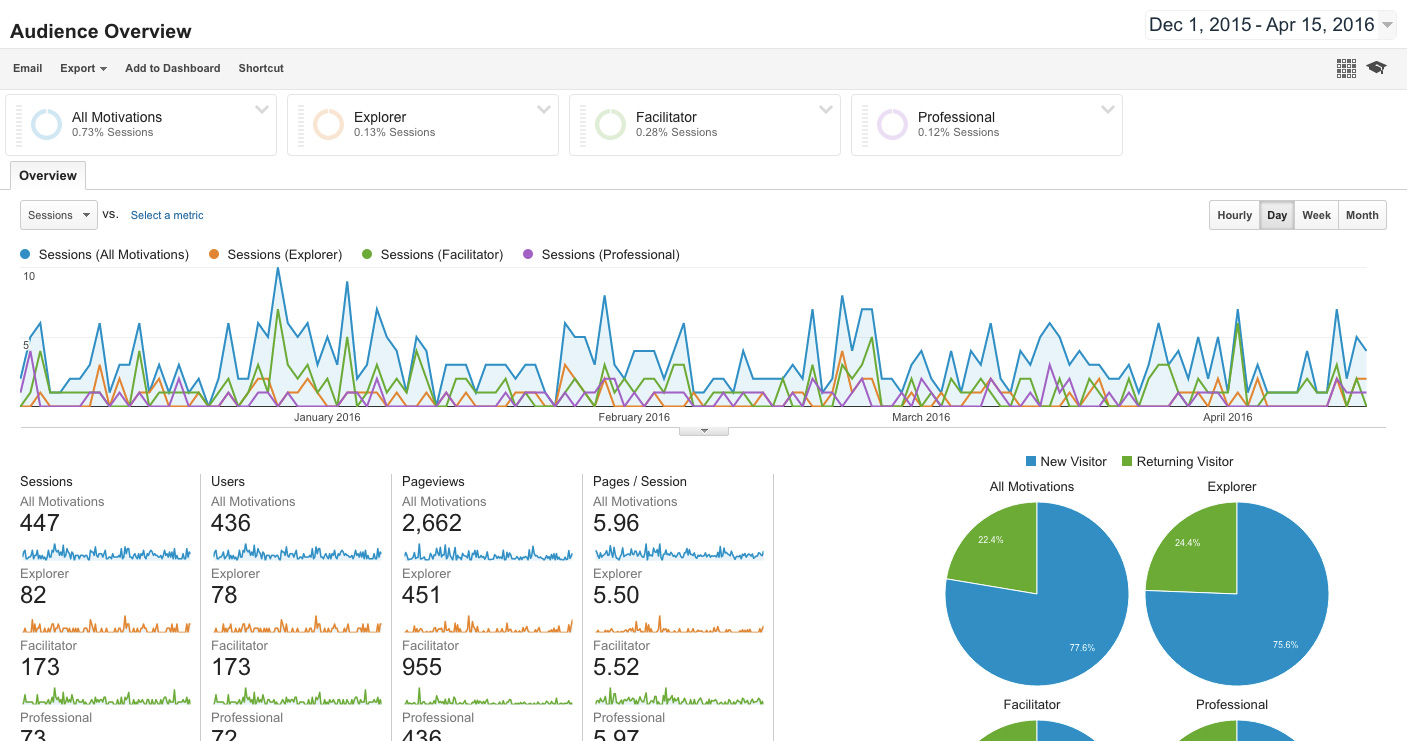
When the visitor chooses a motivation, it sets the Custom Dimension. This is a text string indicating their choice. And that’s the extent of the additional info we’re collecting. The rest is standard Google Analytics. The response is retained for the duration of the browsing session.
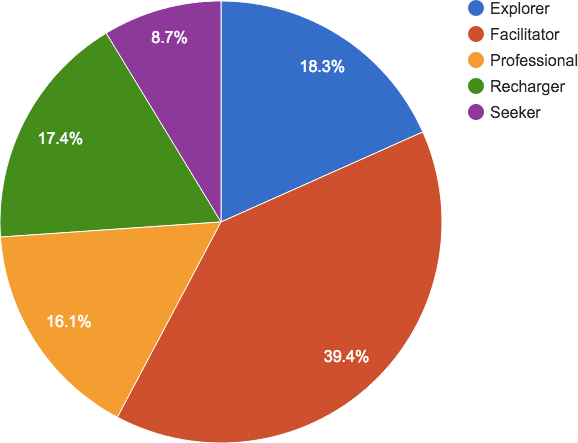
Participants are using the data to better understand how visitors are using their website and inform their work at their individual institutions. Here’s a report I ran for the Clyfford Still Museum.
This is website visitor sessions, broken down by motivation. The red area represents the “facilitators,” people who are planning a visit for a group.
One of the things that really resonated with me from Falk’s book is that most museums’ marketing is based on the exhibition schedule, but that most museum visitors have little if any prior knowledge of what’s on. This is particularly true of the Facilitators group, which prompted me to suggest to my institution that our next marketing campaign should be, “Look smart to your friends. Come to the Clyfford Still.”
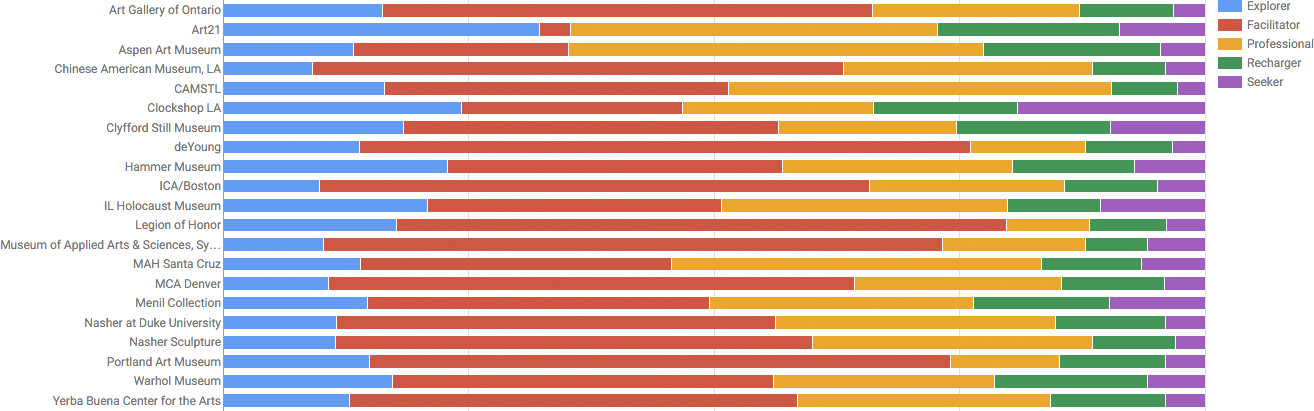
One of the other advantages of this study is the ability to compare data across institutions. Here’s that same “sessions by motivation,” but for all participants. This allows us to spot trends.
In this chart, the “facilitators” are, again, red. As you can see, there’s a fairly consistent breakdown of audience in this way, with Facilitators taking the largest slice of the pie.
But there are also some outliers, which raises interesting questions about what makes those websites unique and what conclusions we can draw from that. We’ve only just begun to unpack the data.
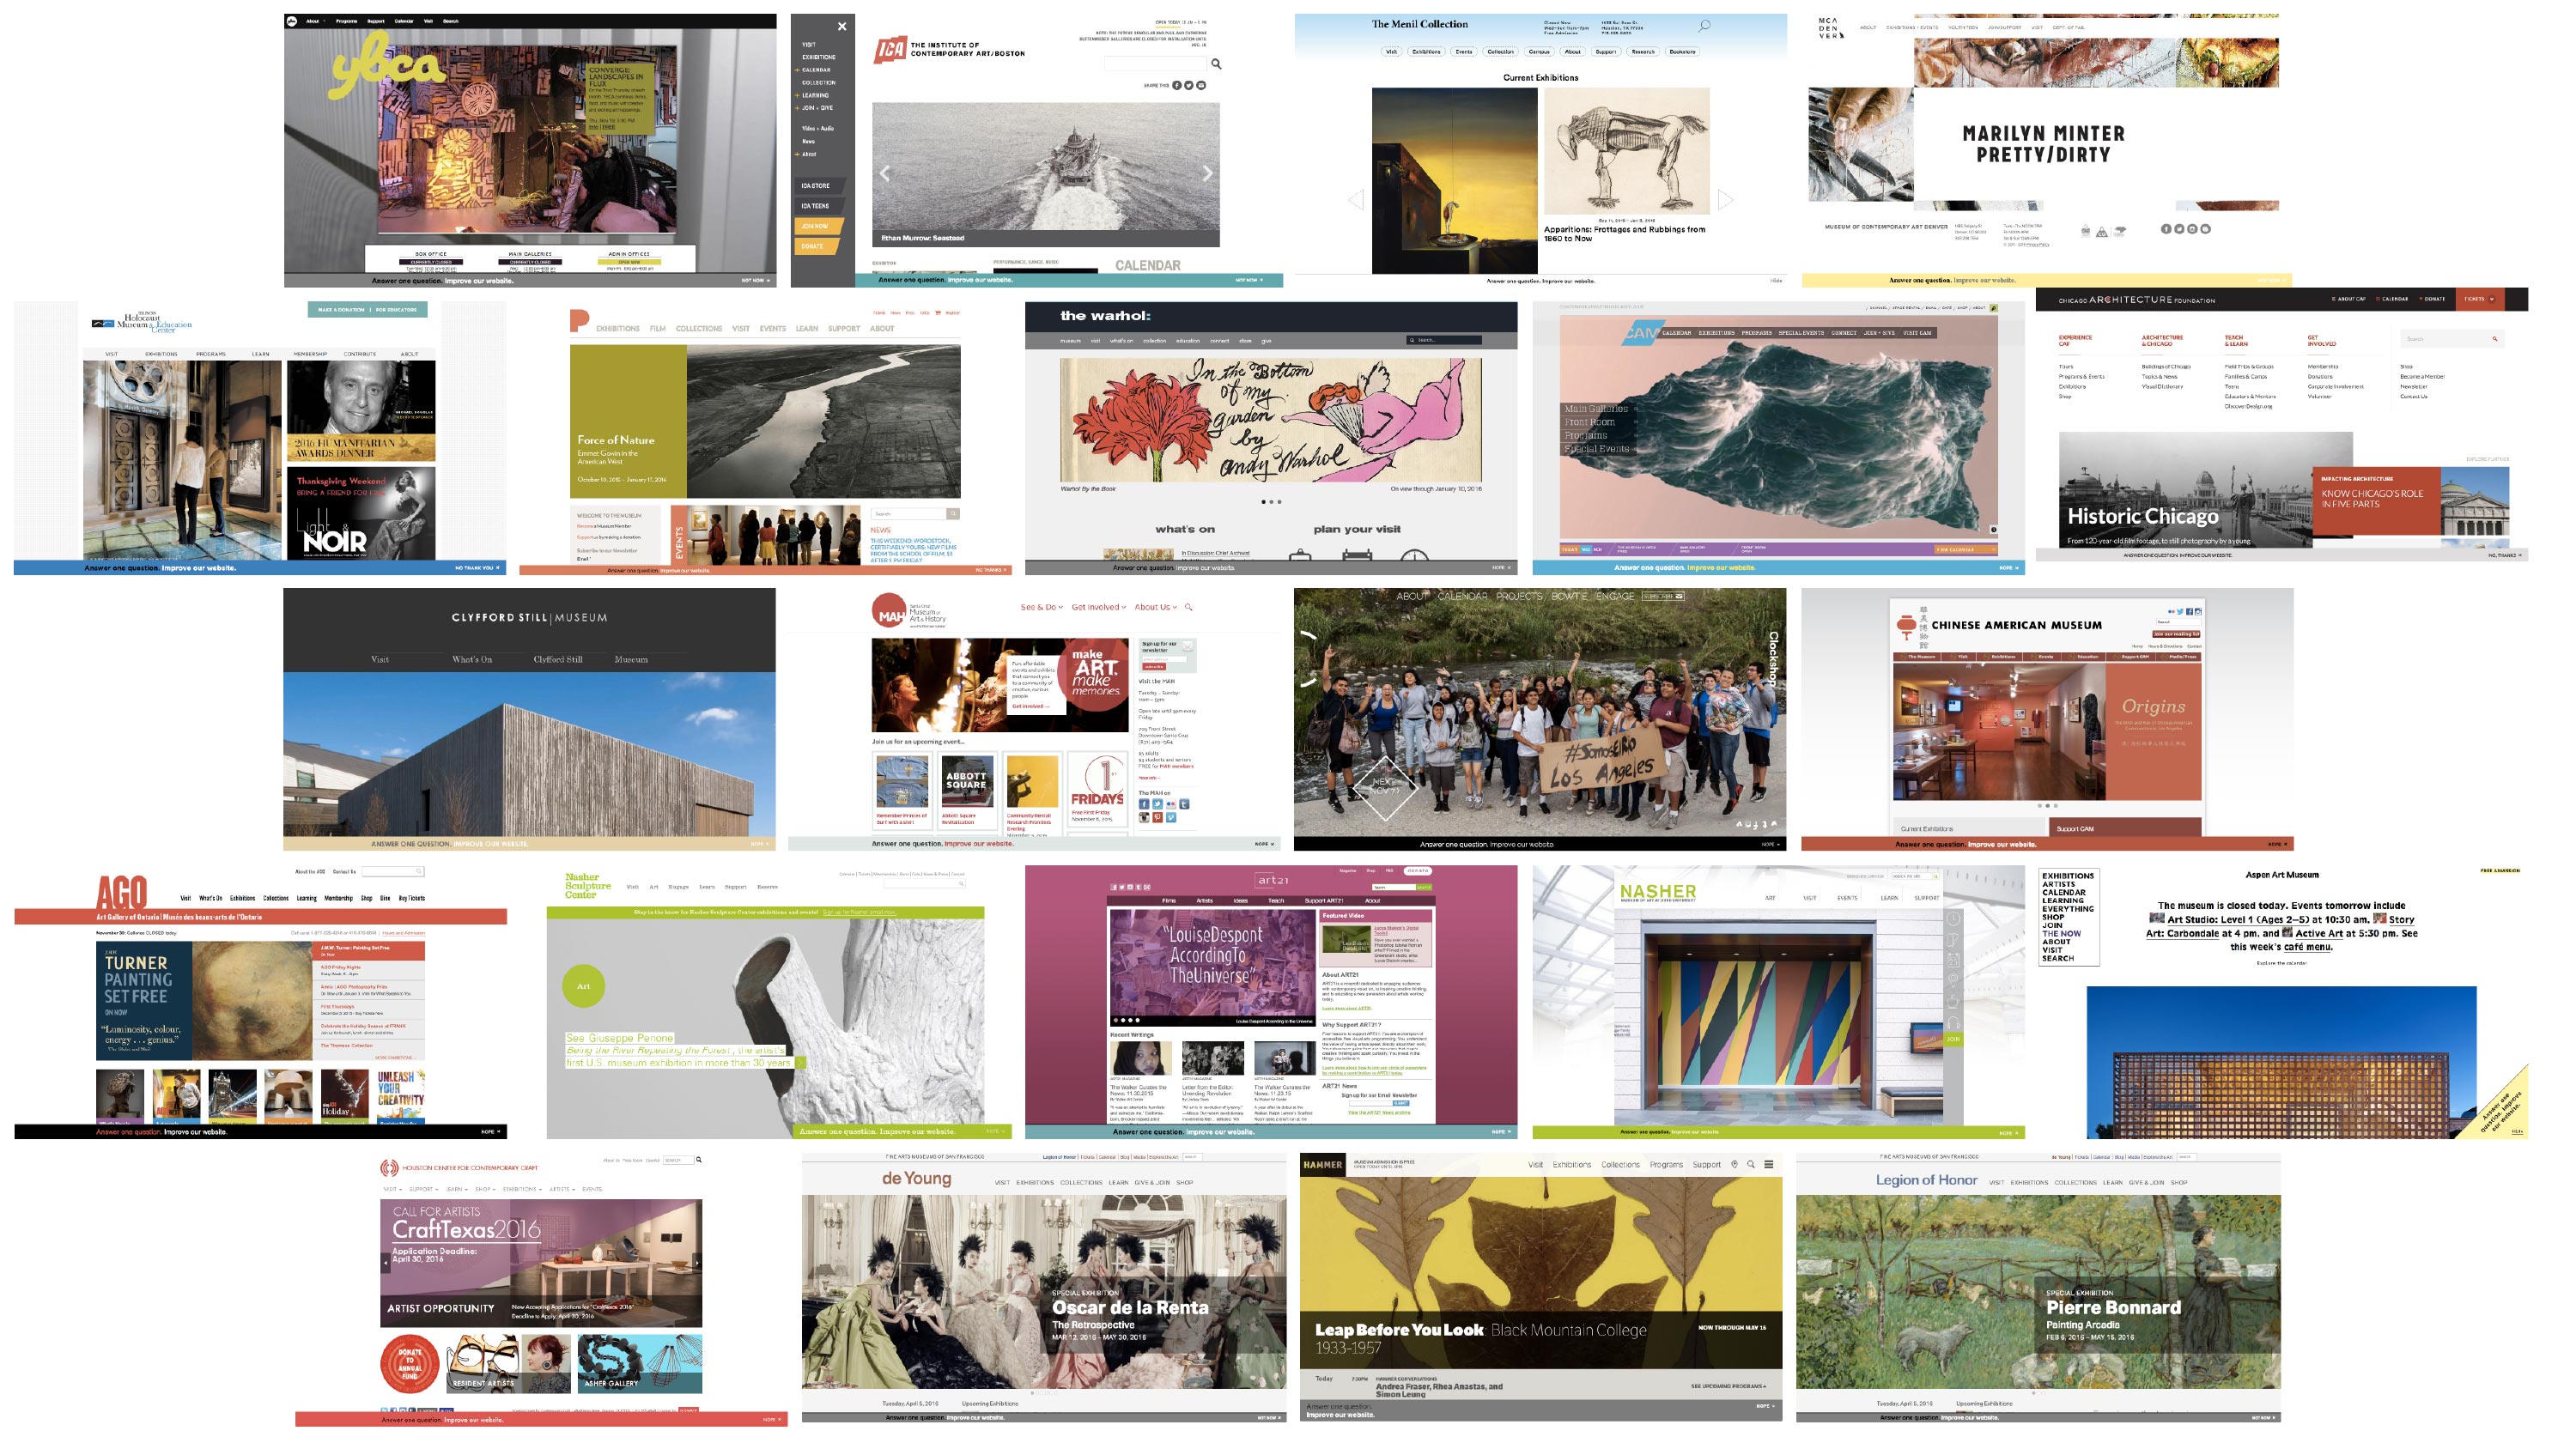
This is not just a research study, but a community of museums who are looking to better understand their online audiences.
In order to facilitate those conversations, we’ve started a forum on Slack. Professionals from each institution use this forum to ask questions and share knowledge.
We have threads dedicated to better understanding audience behavior; to website redesign projects; and to determining the benchmarks and trends that hold true across institutions.
A huge shout out to all the participants for this study. If you are from one of these institutions, please stand up. [Note: At this point our colleagues stood up and received a round of applause. ] If you’re interested in learning more about the study, please feel free to say “hi” to any of us.